A short post tonight with a Geogebra resource that I used when teaching the Normal distribution to my year 12 further mathematicians.
I find that the hardest thing when learning the normal distribution and the linear mapping to the standard normal is that students can’t visualise the areas they are trying to find and how they relate. Because of this I made a small Geogebra app that shows how the areas from an arbitrary normal distribution correspond with the areas on the standard normal. It also proved useful for visualising the effect of changing \(\mu\) and \(\sigma\).
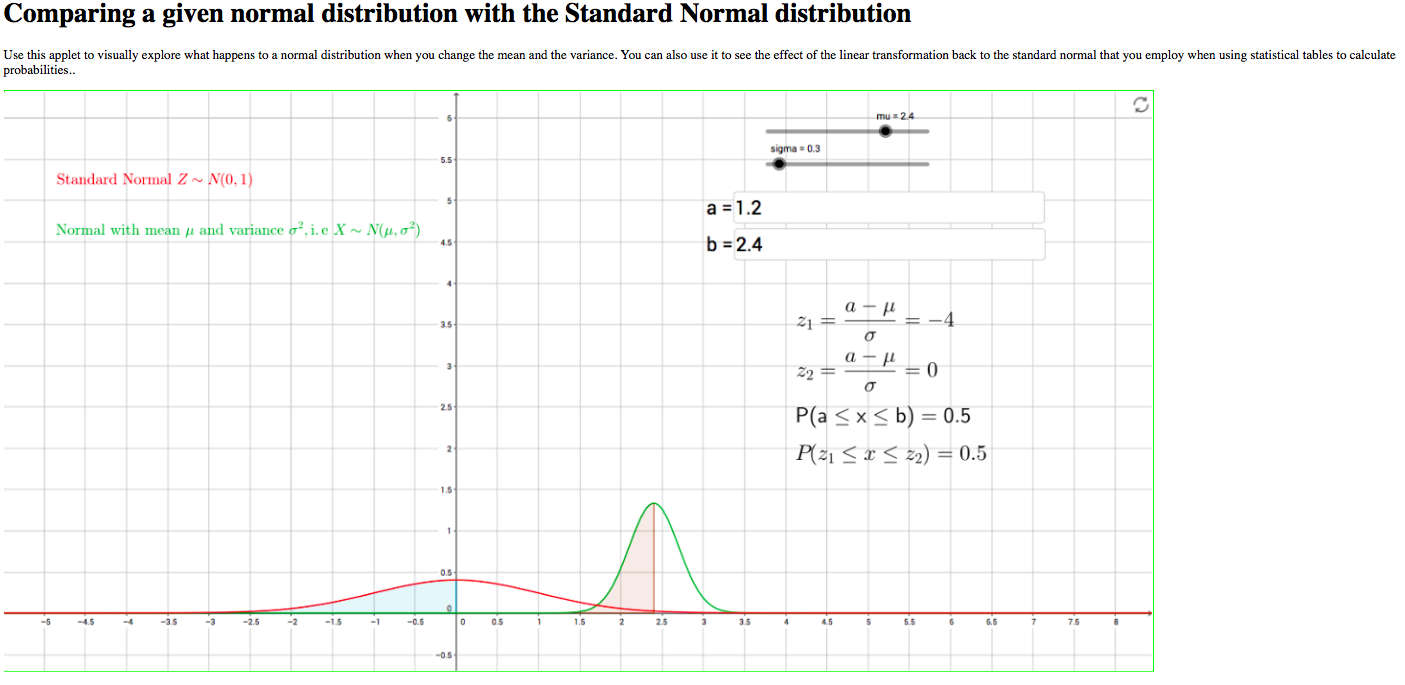
This is available as a webpage and you can also download the geogebra file from this link.