Categories
A Level

Introducing Proof at A-Level

We are almost one year in to the teaching of the new A-Levels in Mathematics and Further Mathematics. The first overarching theme of the new A-Level (as identified in the subject content guidance from the DfE) is “Mathematical Argument, language and proof” as shown below.

Screenshot 2018-06-18 10.26.51

There is a greater focus on this than there used to be and it is something students often struggle with.

To begin with I normally try to link back to the kind of thing they may have seen at GCSE Higher, for example proving properties of products/sums of even numbers. A typical question on this at GCSE would be something similar to “Prove that the sum of four consecutive numbers is always even”.

To move on from this I often use the card sort resource below.

Screenshot 2018-06-18 10.52.49

The idea for this is that students work in groups to discuss the 12 statements and sort them into always, sometimes or never true. Some of these are harder than others, and listening in to their conversations is particularly interesting and can provide a good idea of how quickly to move on with the class.

This activity can be downloaded here.

This activity is one of many included in the new book on proof that I have co-authored for Tarquin Group. The book is called “Understanding Proof” and is available from the publisher here.

Screenshot 2018-06-18 13.40.06

If you are interested in this book the voucher code PROOF718 will give you a £5 discount when ordered from Tarquin direct (it should work till the end of July. This code will infect work for anything in the Tarquin A-Level range – I hope this tempts people. We are proud of this book and I would love to hear any readers’ thoughts.

Sorry that this post has ended with a bit of a plug for a paid-for book…. I’d love you to comment on how you introduce the concept of proof at A-Level.

Categories
A Level Software Teaching

An Experimental Lesson

Since visiting The De Ferrers Academy a few years ago I have thought about trying to create a video using ExplainEverything. This half term was my school’s “Take a Risk” observation window. We have one of these every year and I think it’s quite a good idea as the outcome of the observation doesn’t count formally so it does encourage taking a bit more of a risk with the lesson.

For mine this time I was being observed with my Year 13 further mathematicians and we were going to be starting to look at the FP3 conic sections stuff.

My plan was to produce a video introducing the Ellipse using ExplainEverything and then provide some questions for the students to work through without any help from me.

Here is the video:

As you can see the video bears a few hallmarks from it being created at 2am and there are some things that I don’t think I explained terribly well in a mathematical sense. However, it seemed to serve its purpose well and my students were able to tackle the questions that I had given them, such as this one

Screenshot 2016-02-13 16.31.40

I had two versions of the questions; one with more intermediate steps to guide students through the question. Thanks to Stuart (@sxpmaths) for the picture of the ellipse I used in the questions, it saved me from drawing my own.

Before the lesson my students also had access to the two Geogebra applets featured in the video, that I created and hosted on my website. The first allowed students to explore the parametrisation of the ellipse and investigate the foci property of an ellipse.Screenshot 2016-02-13 16.43.32

The second demonstrated one method of constructing an ellipse (without equations) known as the Trammel Construction.Screenshot 2016-02-13 16.45.09

I’ve put all the worksheets on my website and they are available as follows:

Feel free to use them if you wish.

PS:- In case you are interested, I got very good feedback for this lesson 🙂

Categories
A Level Teaching

A Normal Distribution Card Sort

Today I delivered my session on Core Maths which was part of my gap task for the NCETM Level 3 PD Lead course that I am doing. As part of the session we were looking at the normal distribution and the style of exam questions about this topic on the AQA Level 3 Mathematical Studies qualification assessments.

One of the teaching aids that the groups discussed was a card sort on the normal distribution, which is available on my website here and previewed below. Screenshot 2016-02-08 21.56.16

We talked about how to differentiate the activity (both up and down) and how to use it in relation with other teaching approaches etc.

Feel free to use it, some of the calculation cards do not necessarily show the clearest or most efficient method of working out the answer – this is because they are intended as discussion points.

Any comments gratefully received.

Categories
A Level Software

An Undiscovered MATLAB Function

Regular readers here will know that I love using MATLAB for some things but earlier this week I discovered a function that I hadn’t used before and is surprisingly useful.

I wanted to produce some diagrams showing portions of a normal distribution shaded and had tried to do it in Geogebra but wasn’t quite happy with the results. I then decided to try R but for some reason (probably to do with X-Windows or Quartz) the graphics output on the R installation on my Mac wasn’t working properly so I fired up MATLAB. My original intention was to plot the normal distribution function I was interested in, then plot the vertical lines at the limits and then shade the region. However, I discovered that in the “Statistics and Machine Learning Toolbox” there was a function called \(\texttt{normspec}\).

The syntax for this function is described in detail in the documentation but essentially this function can be used to shade a region under a given normal distribution. The syntax is \(\texttt{p = normspec(specs,mu,sigma)}\) and this plots the normal distribution with mean \(\texttt{mu}\) and standard deviation \(\texttt{sigma}\). It then shades the portion inside the specification limits given by the two element vector \(\texttt{specs}\) – you can use \(\texttt{-Inf}\) or \(\texttt{Inf}\) if there is no lower or upper limit respectively.

For example, the command \(\texttt{p = normspec([-Inf,65],65,5)}\) produces the plot shown below:


I’d encourage you to go and try it out if you have a MATLAB licence.

Categories
A Level Teaching

Anscombe’s Quartet

A while ago I was introduced to this by Manan (@shahlock) and meant to blog about it then – only a 4 month delay.

In 1973 the statistician Francis Anscombe published this paper concerning the importance of computer visualisations of data.

Computer technology has moved on, but his main point about the importance of visualising data as well as calculating summary statistics is still true today.

These 4 data sets, given below have many of the same common summary statistics:

  • Mean of X
  • Mean of Y (to two decimal places)
  • The Variance of X
  • The Variance of Y (to three decimal places)
  • Correlation between X and Y in each case (to three decimal places)
  • The linear regression line for each is \(\)y = 3.00 + 5.00x (to two and three decimal places respectively)

  
Being presented with just the sample statistics you could believe that the data sets are the same, or at the very least that the numbers are drawn from the same distribution.

However when you plot them, it becomes clear that the data sets are very different.

anscombe


Quite often, presenting data visually seems to be overlooked as it is so easy to generate summary statistics but this classical example highlights the danger.

I’m planning on giving an exploration of this as an A-Level Homework at some point during the teaching of S1 this year, and have produced this sheet of prompts.

Categories
A Level summerblogchallenge Uncategorized

Summer Further Mathematics Taster Questions

Over the summer holidays I like my prospective Year 12 Further Mathematicians to look at some maths over the holiday (I do emphasise the importance of having a proper holiday too!). For the last couple of years I have given them these 3 questions (which I have found from various places over the years) to look at:


I admit that these questions are not reflective of further mathematics questions and I say this to the students. In addition, I emphasise that I am not expecting full solutions, that they are hard questions and that they shouldn’t be worried if they get stuck. I explain that I am interested in seeing how they think mathematically and them building up the resilience to spend longer struggling through a problem and trying multiple approaches. For many of them this will be the first time they have come up against a problem that requires a bit more thought than “just do it”.

If you want, you can download the questions here – let me know what you think.

Categories
A Level

Stuart’s Puzzle

A couple of weeks ago Stuart Price (@sxpmaths) posted this question on Twitter

  
I hadn’t really thought about it before but it is a bit strange that we ask similar questions about the mean in Year 7 but (I at least) have never asked an A-Level student this kind of question before. 

I think it’s a really nice little question, one that is harder than you expect and gives students plenty of time to practise their algebra. My workings are below; as you can see I made a few little errors that I had to correct as I went and of course I used Wolfram Alpha instead of solving the quadratic manually! 

  
I will definitely be using this next year when I teach S1. 

Categories
A Level Teaching

Partial Fractions

As I teach Further Maths I haven’t really considered how I would teach partial fractions, and normally just do them in my head without writing down any workings.

However, I have recently started providing some last minute tuition and one of the things they wanted explaining was partial fractions. To be honest I have forgotten how I was taught this, I have a feeling it was the “substitute different x values in to knock out terms” method. I went through two slightly different methods for the partial fraction shown below

  
Personally I prefer Method 1 but I think Method 2 would probably be better for the weaker students as it shows explicitly what is happening. 

How do other people teach this?

Categories
A Level Software Teaching

Geogebra and Further Maths

This week I had an observed lesson, where the remit was that I do something risky that I perhaps wouldn’t have done otherwise.

My Year 12 Further Maths class had been selected as my observation lesson – I found thinknig of something risky to do with them harder than if it had been any other group. They are used to me doing odd things, that are a bit off the wall with them and they always respond well. In the end I decided to use ICT and try to get them to do some independent discovery work.

We have just started the coordinate geometry section of FP1 (Edexcel) and wer due to look at the parabola this week. I have used GeoGebra a bit in the past but I had never created my own geogebra worksheet before and this seemed like the perfect opportunity.

So, one evening I installed the latest version of GeoGebra on my MacBook, signed up for a GeoGebra Tube account and set about creating a worksheet where students would be able to explore the parametric equations of a parabola and the focus directrix property for themselves. I then uploaded the file to GeoGebra Tube, and got the content ID from the embed option. As I didn’t want to rely on GeoGebra being installed / working on all the computers in my teaching room I decided to upload a html version to my own webpage. The GeoGebra tean have made this really easy by poviding a javascript library that you can just source at the top of your html code and then a really simple API to embed a dynamic worksheet in your webpage. They have provided examples of how to do this.The web apps for the Parabola and Hyperbola that I created are here. On loading the page you should see a screen that looks like this:

I then wrote a sheet with some questions to guide the students’ explorations here, these questions should prompt them to derive the parametric equations of the parabola and notice the focus-directrix property. It is significantly harder to answer the questions concerning the hyperbola – I saw these as hard extension questions.

All of my class seemed to enjoy using these and engaged well with the work. Walking round the room I also saw some great responses to questions. 

To produce the worksheets, upload to GeoGebra Tube and then host on my website took in total about 2 hours which I don’t think is bad for a first time. 

My intention is to use GeoGebra moe across the keystages, any worksheets I create I will share through my website as well as GeoGebra Tube. The original GeoGebra files (in case you want to modify them) are here (parabola) and here (hyperbola). I will also be adding a worksheet for the Ellipse to the webpage later too. 

Some examples of students responses to the questions are shown below:


Update: Please be aware that for the web applets to load there has to be communication with the GeoGebra website, so make sure that is not on your schools block list. 

Categories
A Level Software Teaching

Matlab in the Classroom

One of the things I have missed since teaching in a school is the fact that I don’t have access to Matlab….

Matlab is a product from The Mathworks, designed originally for numerical computation (indeed the name derives from MATrix LABoratory as the software was originally focussed towards operations on matrices) but which now is capable of much more. More information about Matlab and The Mathworks is available here.

I had got used to using Matlab in teaching an demonstrating, not least because of the ease with which you can use it to check matrix computations, plot graphs of functions and demonstrate numerical methods.

Last term I set my Year 12 Further Mathematicians some homework which involved them researching the Jacobi Method and performing 2 iterations of this method on a \(2 \times 2\) matrix system. I wanted to be able to demonstrate this straightforward numerical method to them, without having to work out how to use the Python IDE on the Windows computers at school, so I decided to give Matlab Mobile a try.

Matlab Mobile was originally released in 2010 (see here for an early blog post discussing Matlab Mobile) but I hadn’t had much reason to use it before. Originally the app needed to connect to your computer with a running copy of Matlab, but since it’s release it has become a lot better. Th app is currently on version 4.1.1 which is a universal app suitable for both the iPad and the iPhone. With this version (as long as you have a valid Matlab Licence for desktop) you can connect to a copy of Matlab running in the cloud to execute commands. You can also upload your files to the cloud so that they can be run from the app.

On opening the app you are presented with a screen that looks like this:

IMG_0538.PNG

The left hand portion of the screen displays commands that you have typed and on the right hand side you can toggle between Figures and viewing your command history.

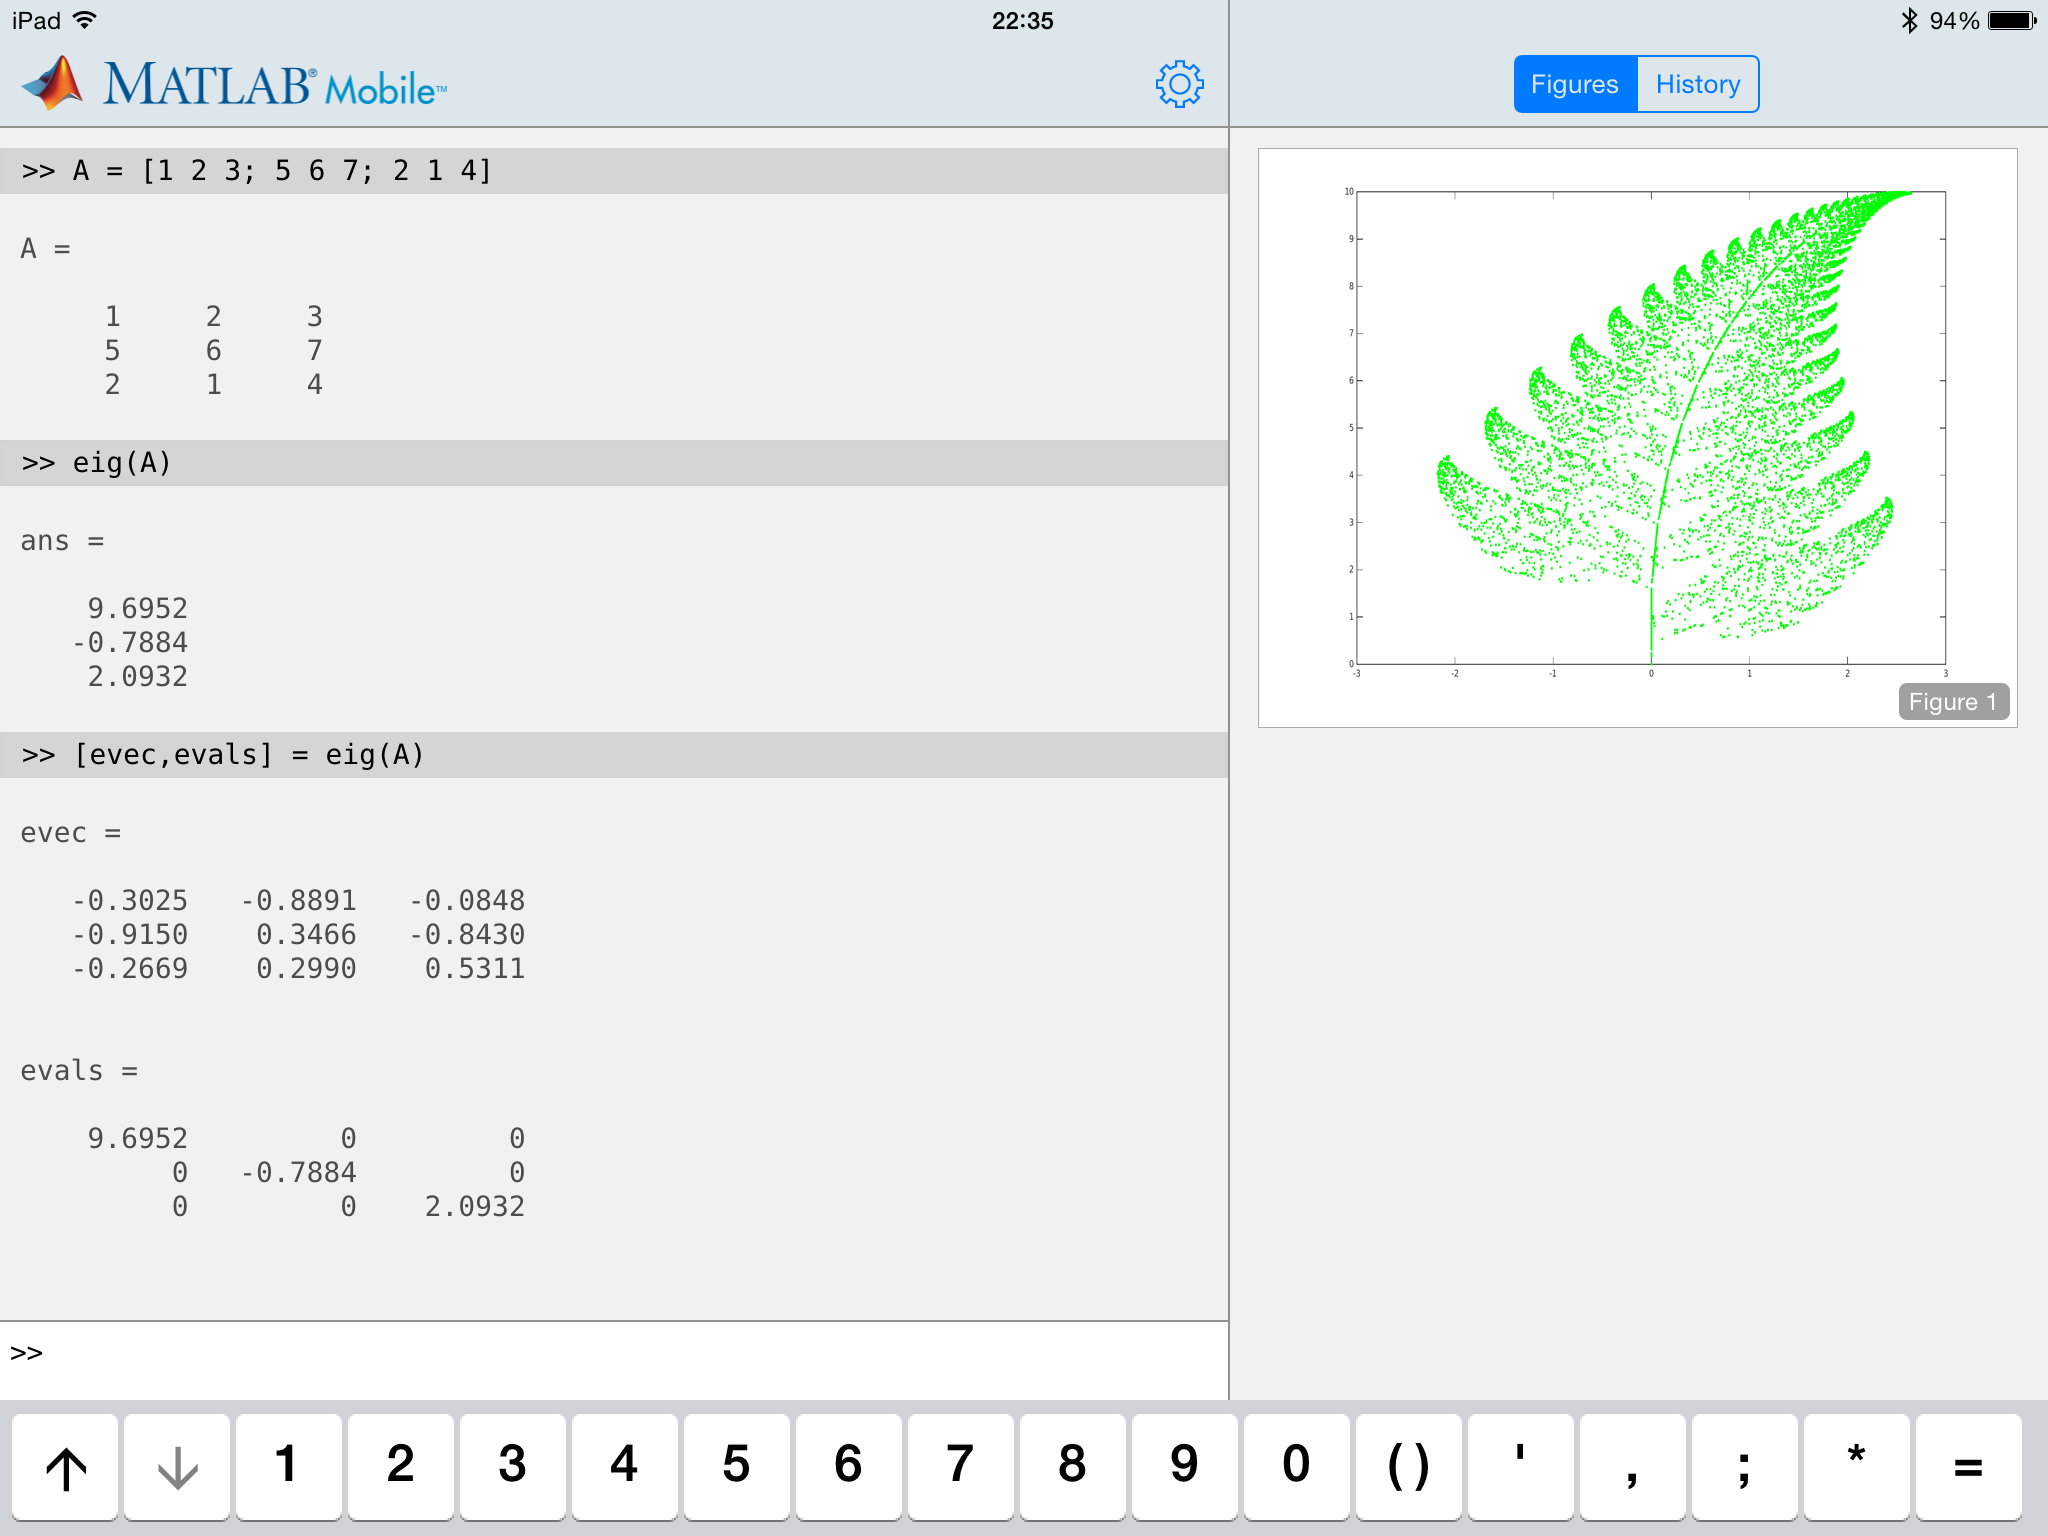
Using a keyboard (I recommend using a bluetooth keyboard here as the on screen keyboard takes up so much space) it is easy to type short commands that accomplish complex things. For example, in the screen shot below, I create a matrix and then find its eigenvalues using the eigs command. As you can see this command can also return the corresponding eigenvectors of a matrix simply by explicitly giving two output arguments to the function.

IMG_0539-0.PNG

One of the great uses of the Matlab desktop product is to prototype functions before coding in another language. Unfortunately, the mobile app does not allow you to edit or create .m script files or function files. This is a real shame, especially as it extends to the inability to make small edits to files you have already stored in the cloud. Luckily though, you can at least view the test of functions that you have written by using the command type in the command window, as shown below.

IMG_0540-0.PNG
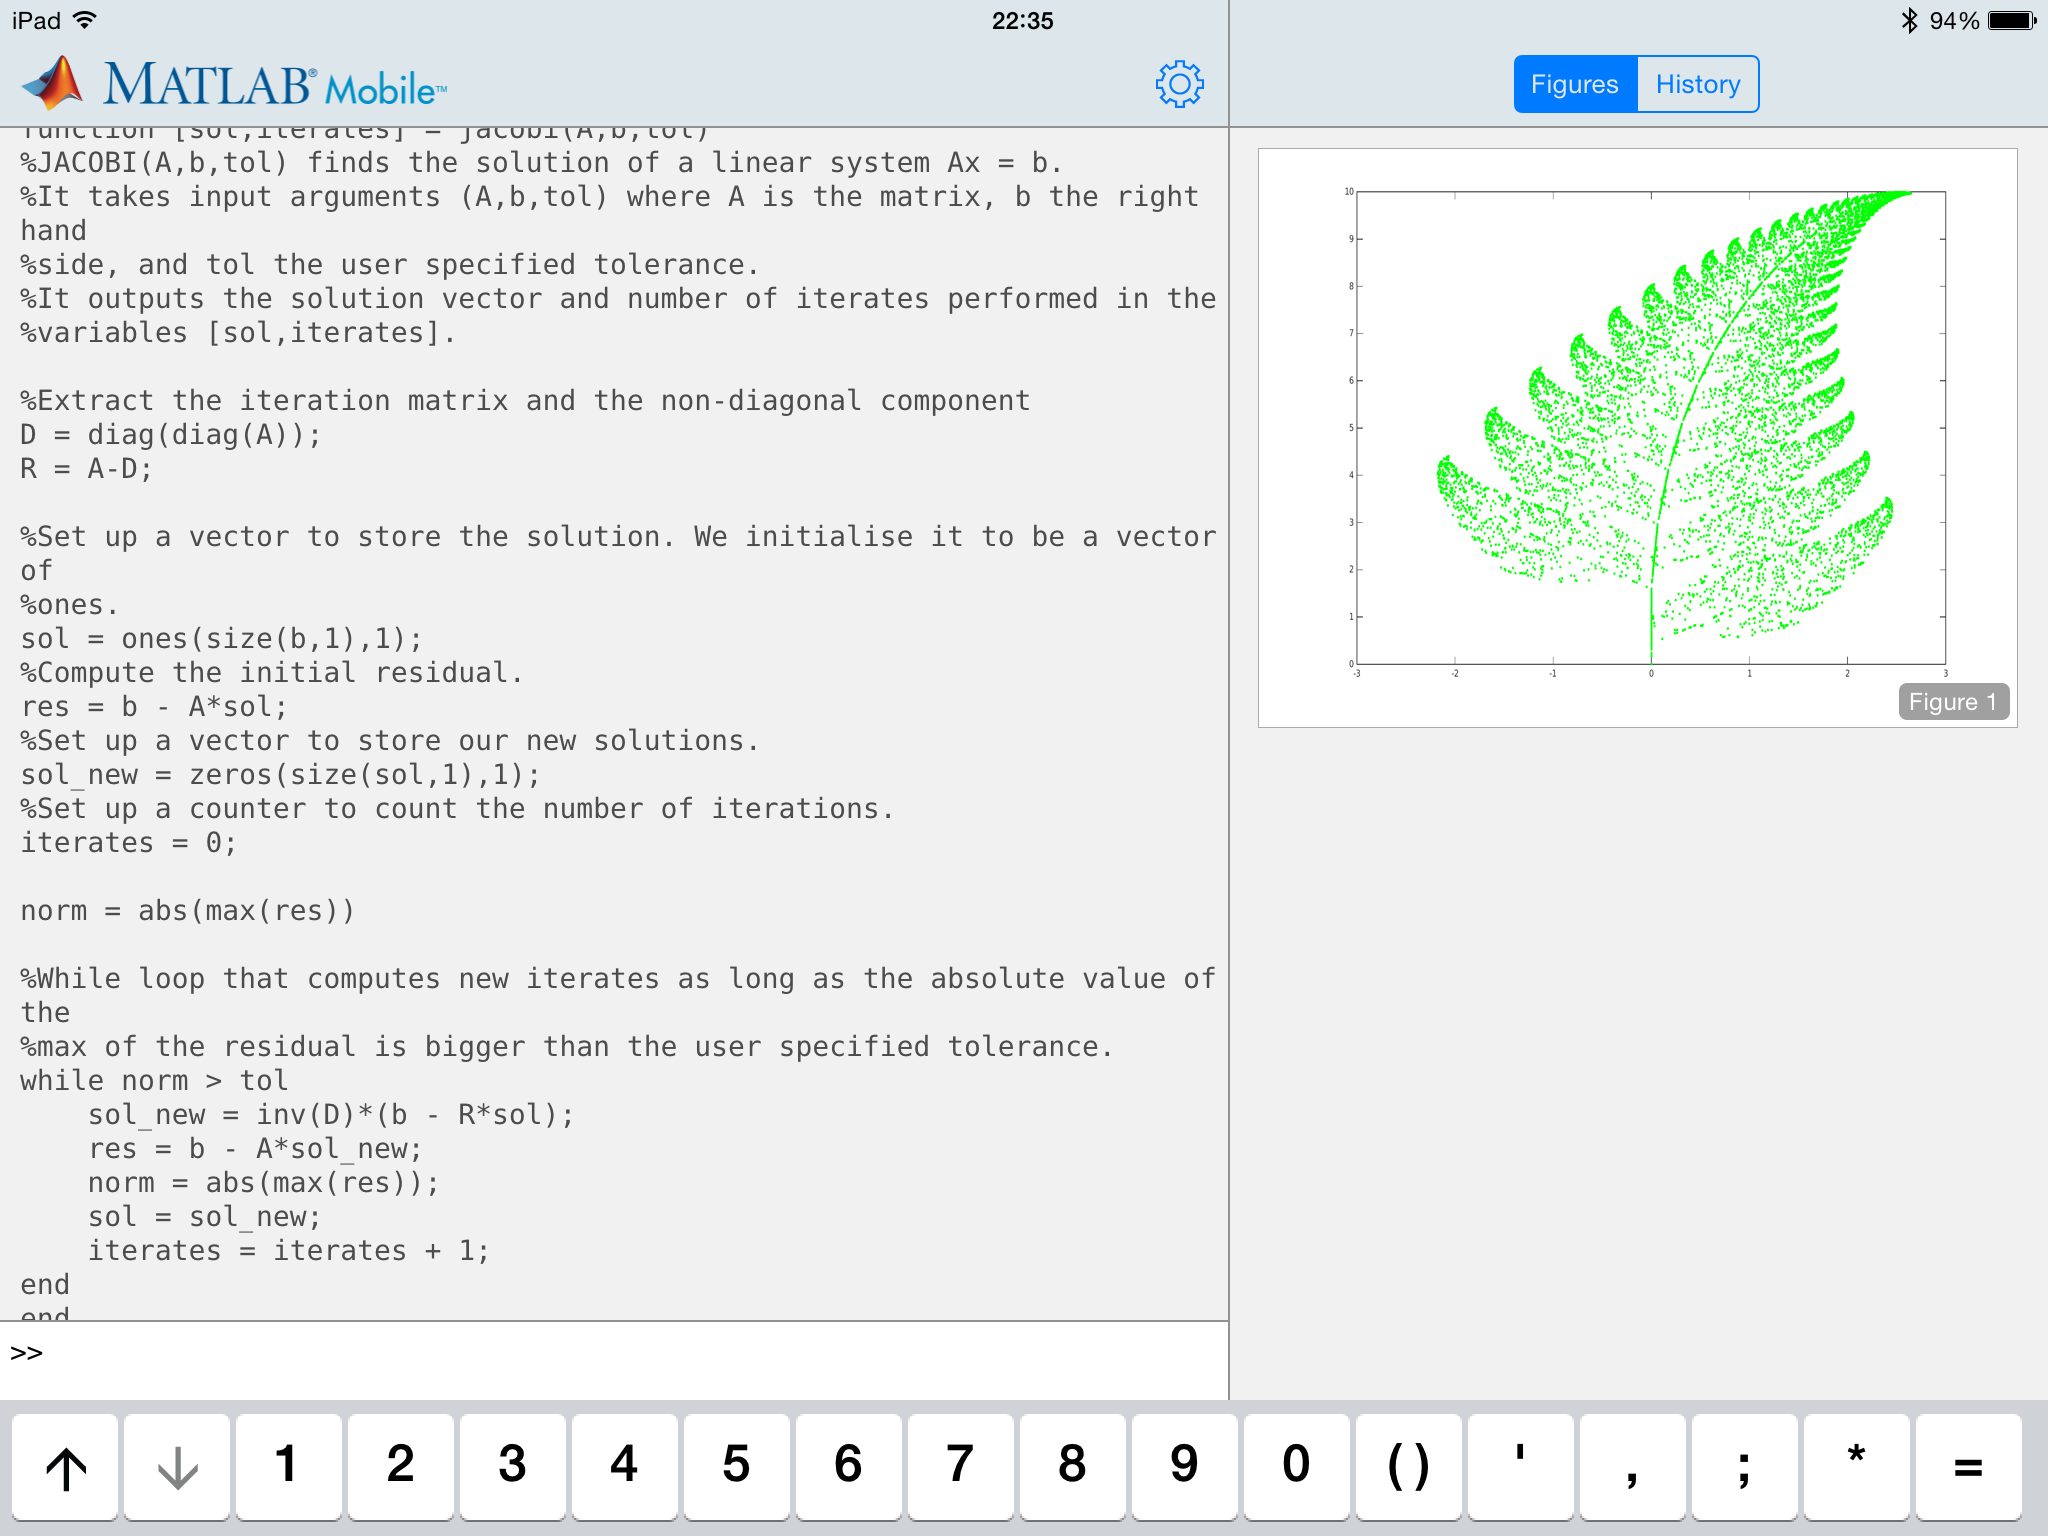
The code shown above is a naive implementation of the iterative Jacobi scheme for solving systems of linear equations – I stress it is not the most efficient way to code this algorithm, but it is clear for teaching purposes. Using Matlab Mobile I was able to discuss this short function with my class, and relate it to the algorithm that they had to research and then express in pseudocode.
If you are going to use Matlab Mobile for a similar purpose I would recommend avoiding writing script files and instead use function files with enough arguments to allow you to vary everything you will want to demonstrate the affect of. I would also say it is probably useful to print more of the internal workings of the function to the command line than you would normally.

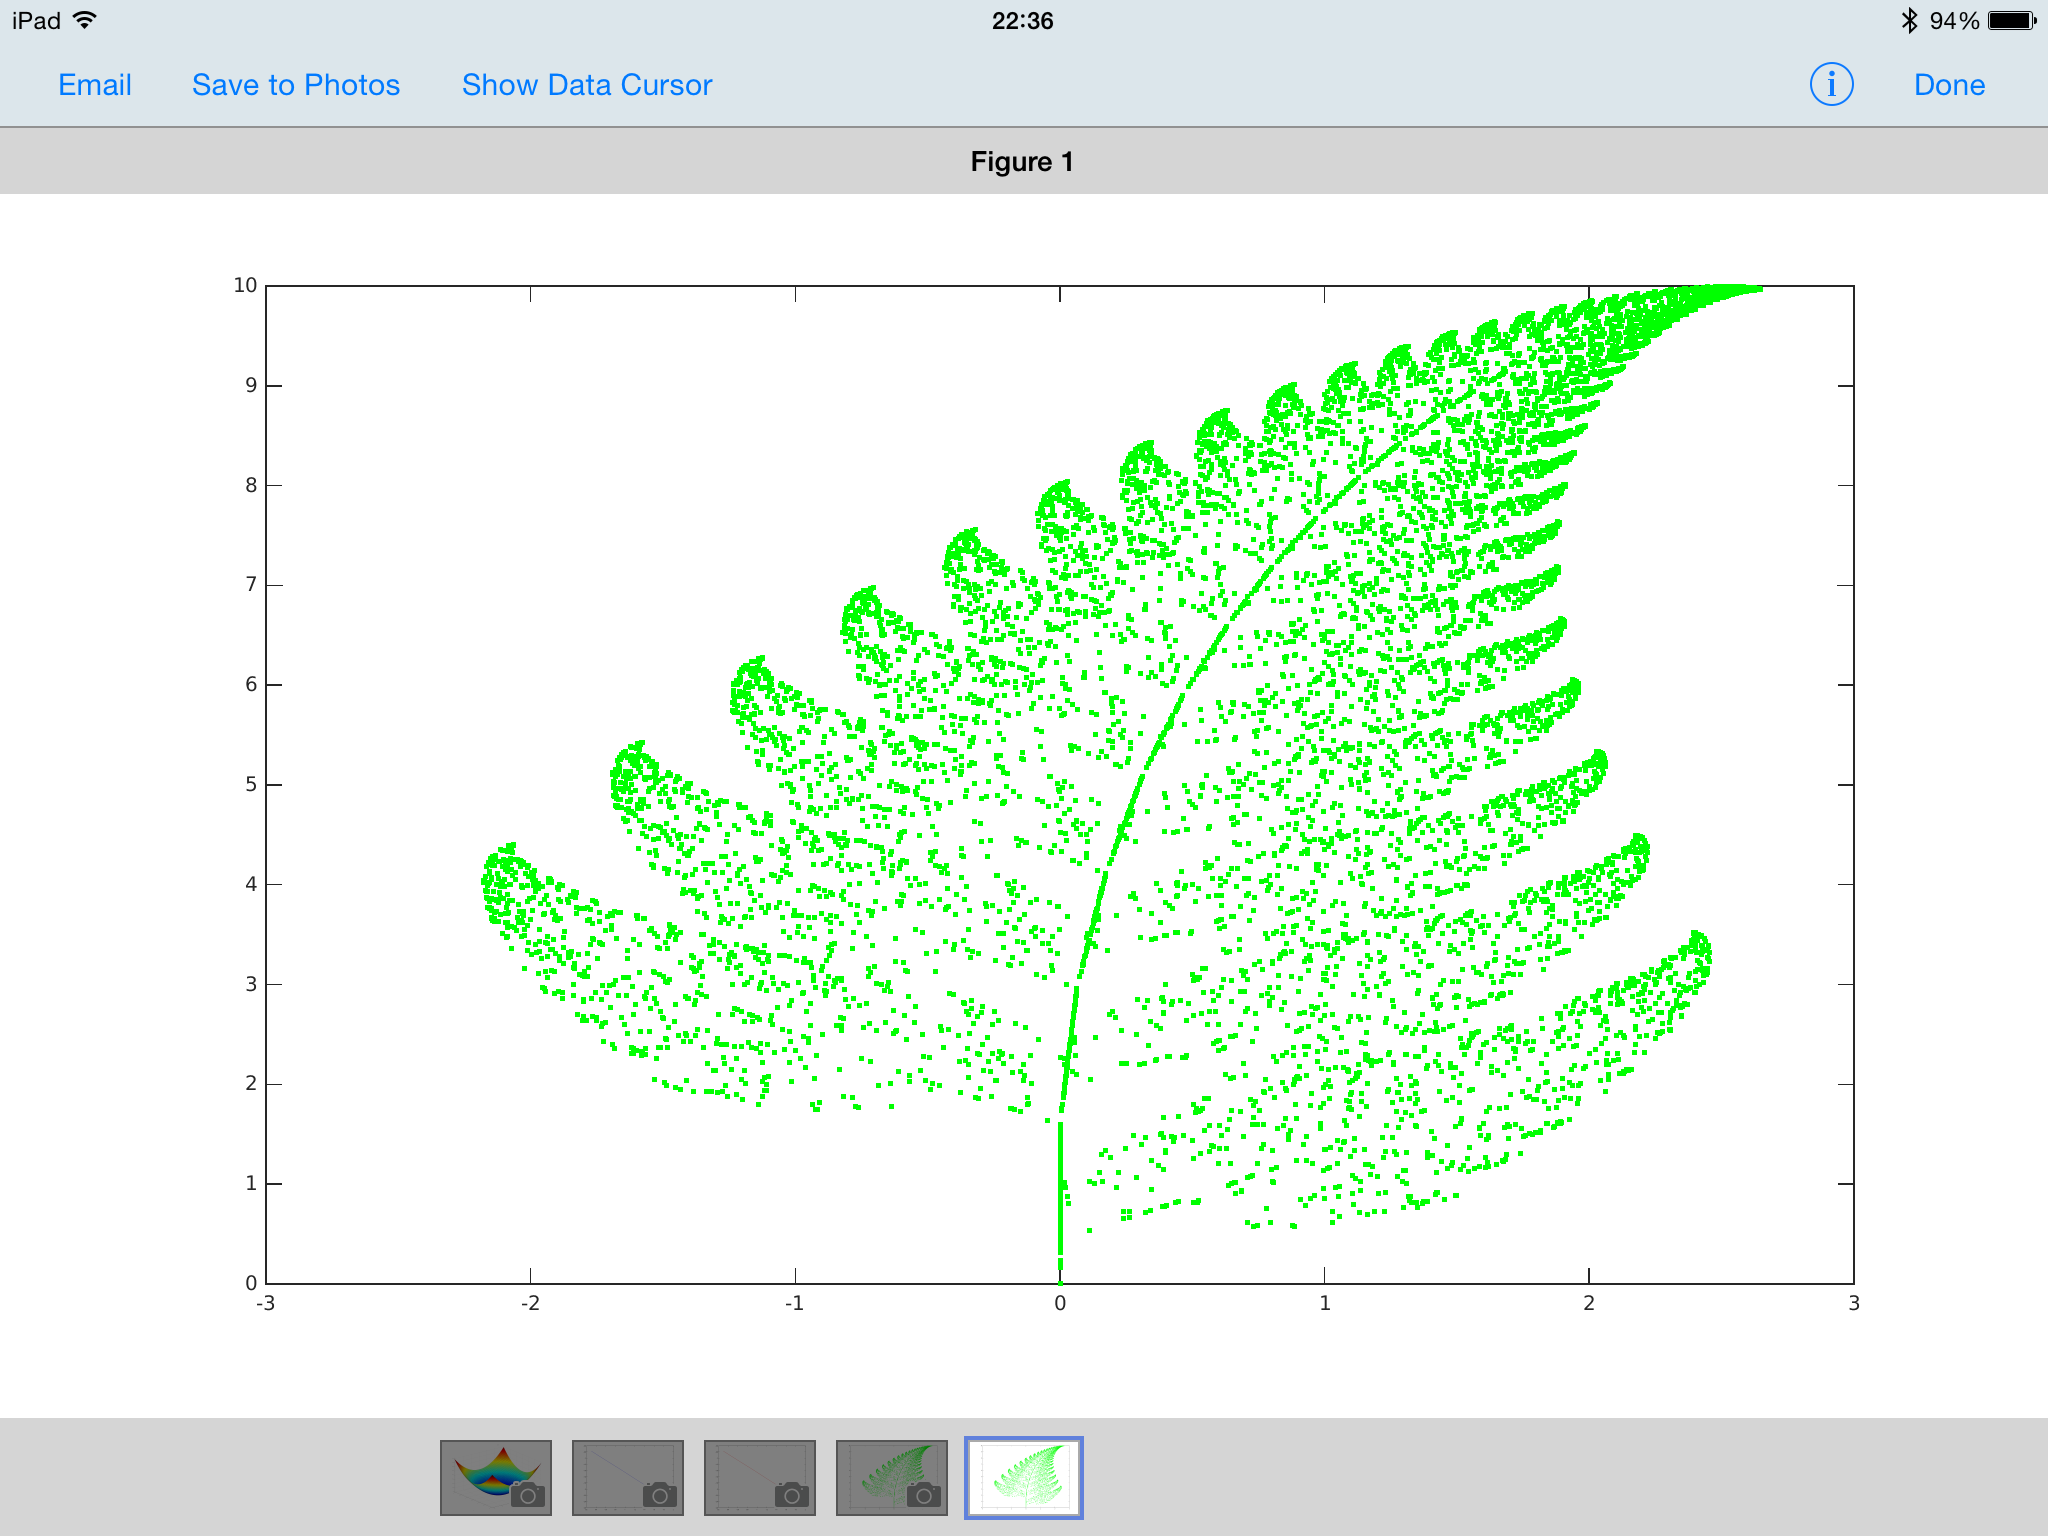
Another great piece of functionality in Matlab is the ability to produce professional looking graphs with very little effort. You can still generate figures such as the one below (a visualisation of the Barnsley fern after 10000 iterations – I may write a blog post about this in the future) in the Cloud, but a lot of the data exploration tools in the figure window of the desktop product are not usable. You can however, save the figure to your camera roll or email it to yourself.

IMG_0541-0.PNG
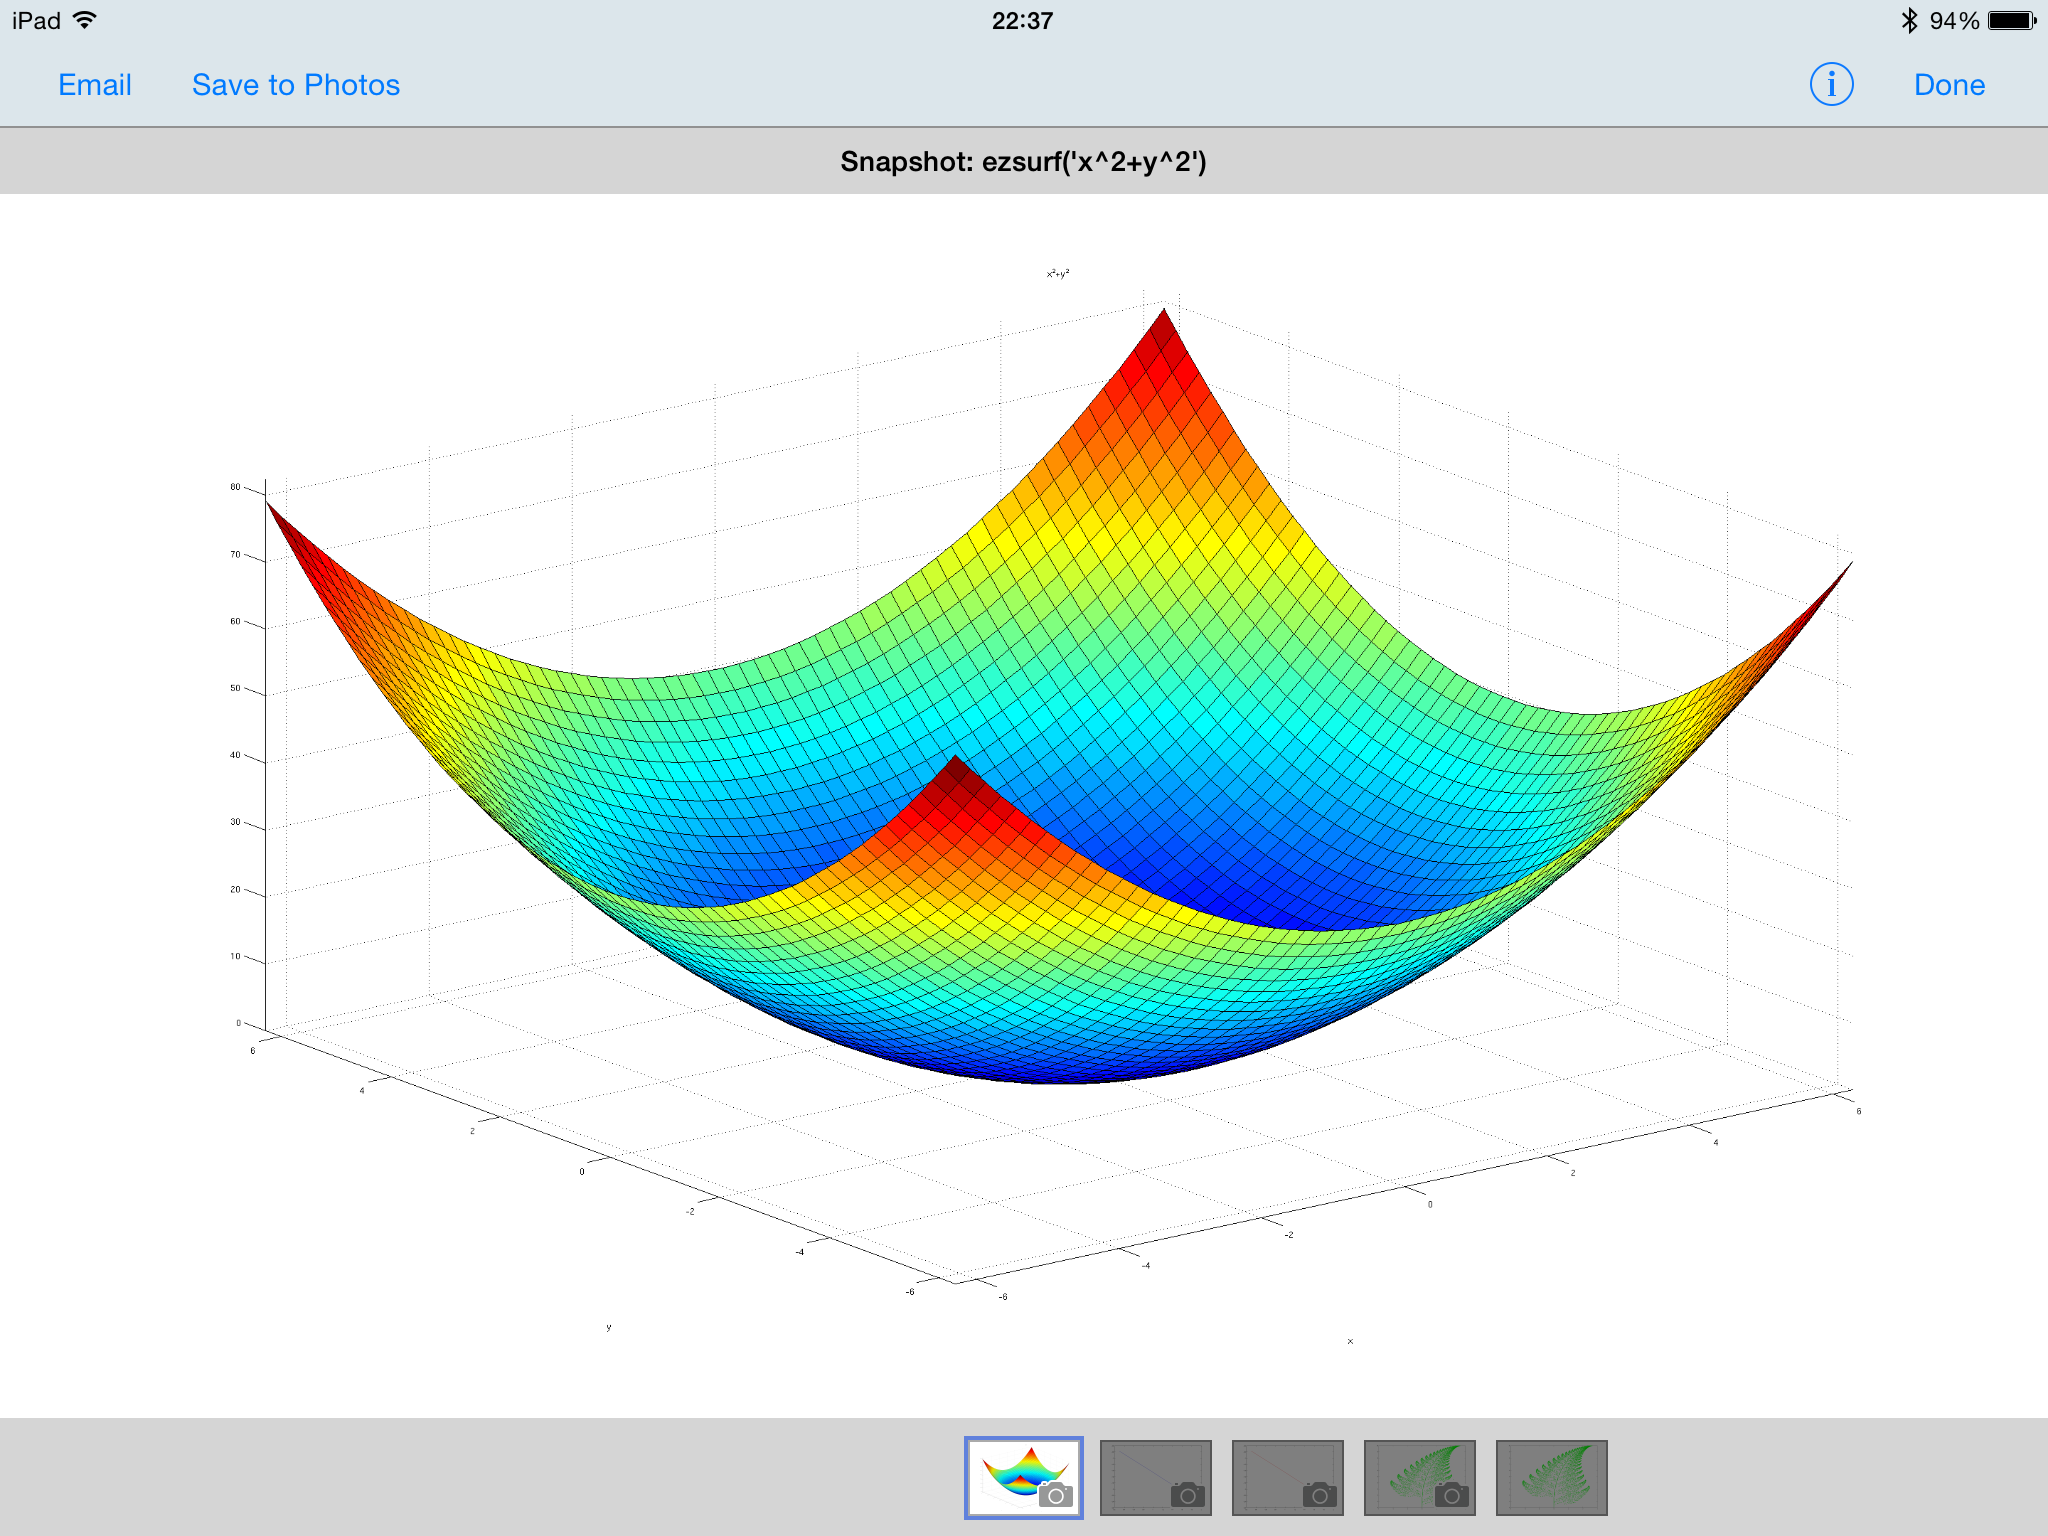
As a final example of the graphical abilities of Matlab Mobile the 3D surface plot below was created using 4 lines of code.

IMG_0542-0.PNG

One important thing to note is that I couldn’t connect to the Matlab Cloud through my schools wifi (I suspect because of the firewall) and so had to resort to using my phone as a 4G hotspot.

All in all, if you have a Matlab licence it is well worth familiarising yourself with the Mobile app, and I managed to do all that I wanted to do in the classroom with it. I just needed to do a bit more forward planning than I would have done if I had had access to the fully fledged Matlab product! Hopefully as the app develops they will remove some of the limitations that are currently present.