Regular readers here will know that I love using MATLAB for some things but earlier this week I discovered a function that I hadn’t used before and is surprisingly useful.
I wanted to produce some diagrams showing portions of a normal distribution shaded and had tried to do it in Geogebra but wasn’t quite happy with the results. I then decided to try R but for some reason (probably to do with X-Windows or Quartz) the graphics output on the R installation on my Mac wasn’t working properly so I fired up MATLAB. My original intention was to plot the normal distribution function I was interested in, then plot the vertical lines at the limits and then shade the region. However, I discovered that in the “Statistics and Machine Learning Toolbox” there was a function called \(\texttt{normspec}\).
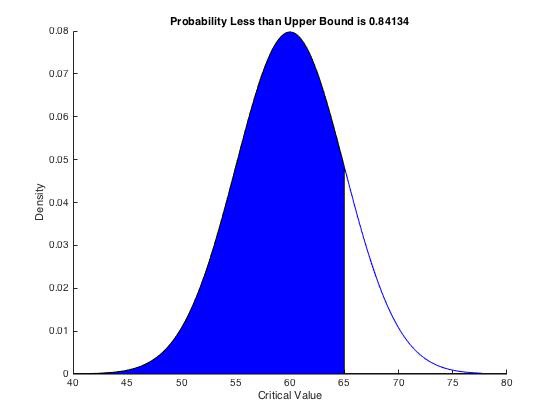
The syntax for this function is described in detail in the documentation but essentially this function can be used to shade a region under a given normal distribution. The syntax is \(\texttt{p = normspec(specs,mu,sigma)}\) and this plots the normal distribution with mean \(\texttt{mu}\) and standard deviation \(\texttt{sigma}\). It then shades the portion inside the specification limits given by the two element vector \(\texttt{specs}\) – you can use \(\texttt{-Inf}\) or \(\texttt{Inf}\) if there is no lower or upper limit respectively.
For example, the command \(\texttt{p = normspec([-Inf,65],65,5)}\) produces the plot shown below:
I’d encourage you to go and try it out if you have a MATLAB licence.