Categories
A Level Software Teaching

An Experimental Lesson

Since visiting The De Ferrers Academy a few years ago I have thought about trying to create a video using ExplainEverything. This half term was my school’s “Take a Risk” observation window. We have one of these every year and I think it’s quite a good idea as the outcome of the observation doesn’t count formally so it does encourage taking a bit more of a risk with the lesson.

For mine this time I was being observed with my Year 13 further mathematicians and we were going to be starting to look at the FP3 conic sections stuff.

My plan was to produce a video introducing the Ellipse using ExplainEverything and then provide some questions for the students to work through without any help from me.

Here is the video:

As you can see the video bears a few hallmarks from it being created at 2am and there are some things that I don’t think I explained terribly well in a mathematical sense. However, it seemed to serve its purpose well and my students were able to tackle the questions that I had given them, such as this one

Screenshot 2016-02-13 16.31.40

I had two versions of the questions; one with more intermediate steps to guide students through the question. Thanks to Stuart (@sxpmaths) for the picture of the ellipse I used in the questions, it saved me from drawing my own.

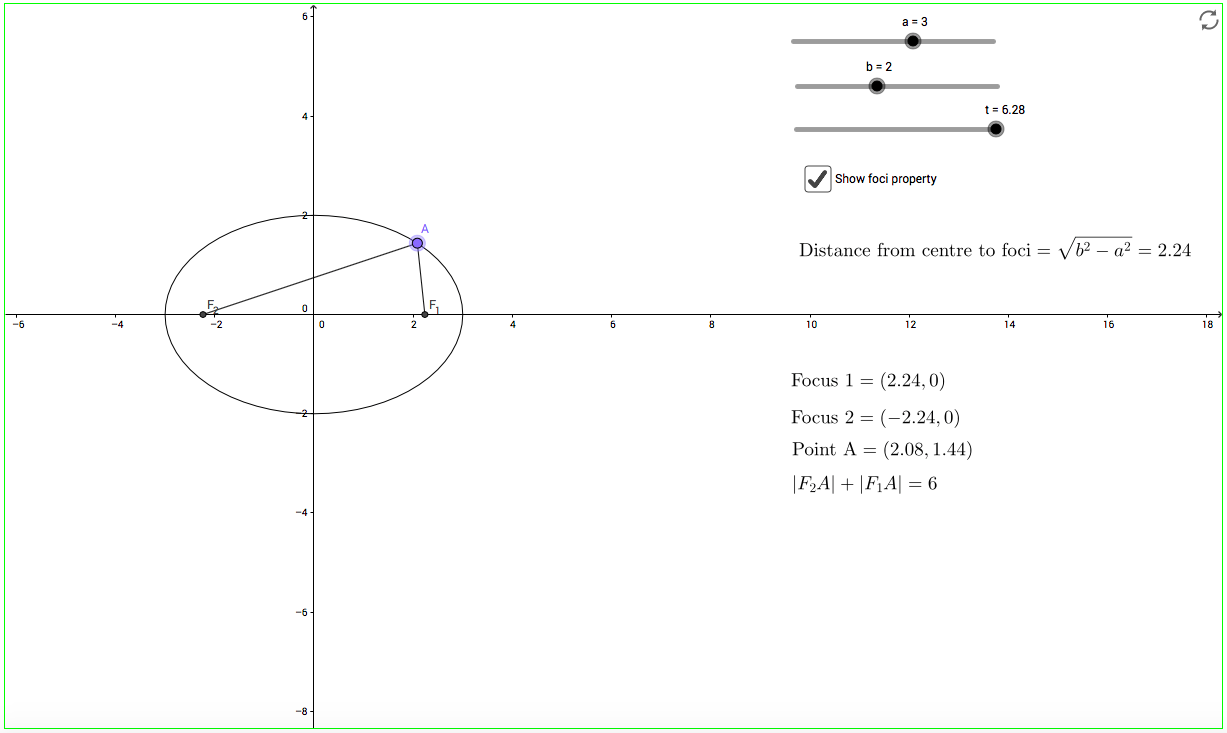
Before the lesson my students also had access to the two Geogebra applets featured in the video, that I created and hosted on my website. The first allowed students to explore the parametrisation of the ellipse and investigate the foci property of an ellipse.Screenshot 2016-02-13 16.43.32

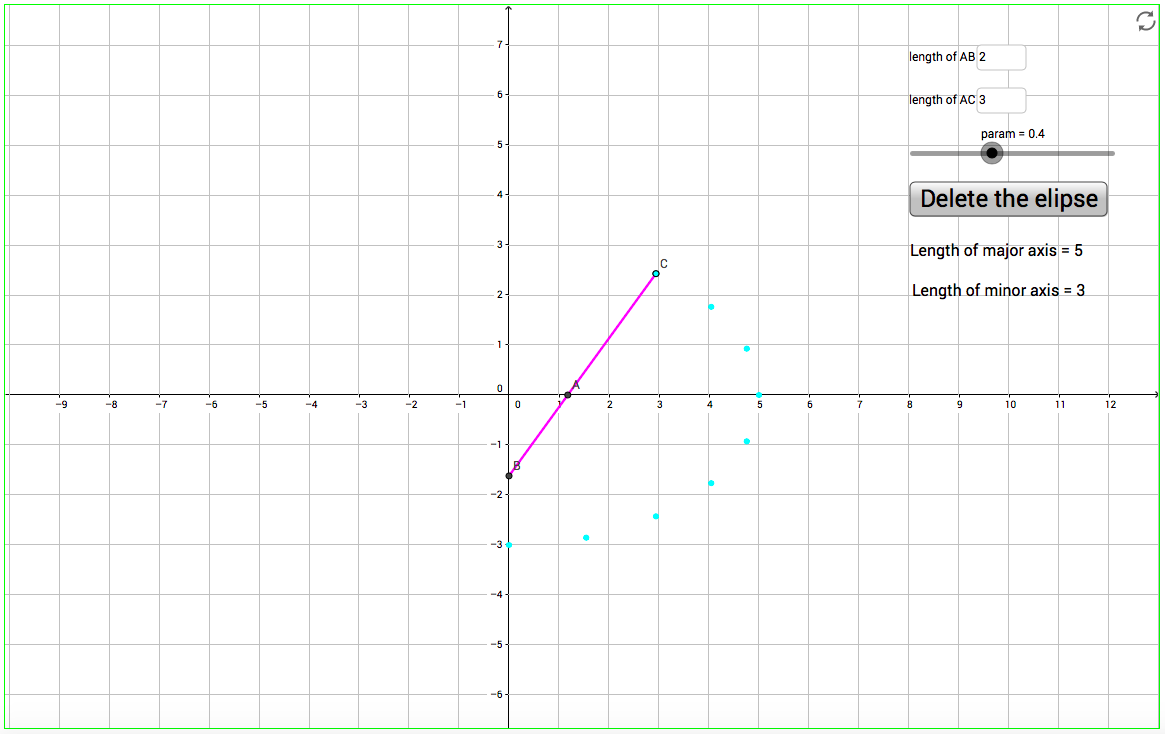
The second demonstrated one method of constructing an ellipse (without equations) known as the Trammel Construction.Screenshot 2016-02-13 16.45.09

I’ve put all the worksheets on my website and they are available as follows:

Feel free to use them if you wish.

PS:- In case you are interested, I got very good feedback for this lesson 🙂

Categories
A Level Teaching

A Normal Distribution Card Sort

Today I delivered my session on Core Maths which was part of my gap task for the NCETM Level 3 PD Lead course that I am doing. As part of the session we were looking at the normal distribution and the style of exam questions about this topic on the AQA Level 3 Mathematical Studies qualification assessments.

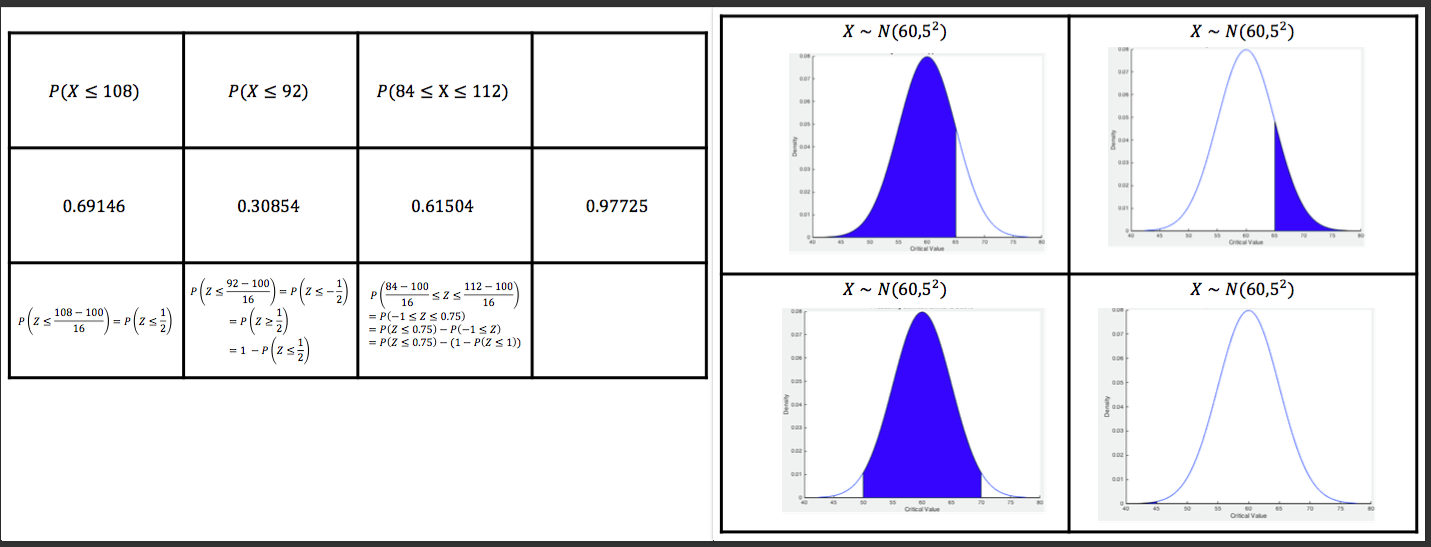
One of the teaching aids that the groups discussed was a card sort on the normal distribution, which is available on my website here and previewed below. Screenshot 2016-02-08 21.56.16

We talked about how to differentiate the activity (both up and down) and how to use it in relation with other teaching approaches etc.

Feel free to use it, some of the calculation cards do not necessarily show the clearest or most efficient method of working out the answer – this is because they are intended as discussion points.

Any comments gratefully received.

Categories
Teaching

Timetable2calendar

This coming academic year my school is going to a two week timetable – in an effort to not get confused I wanted to put it in to my iCloud Work Calendar. With it being a two week timetable, punctuated by half terms and holidays this is a non-trivial task and I was expecting to have to write a bit of python to generate an iCal .ics file to avoid repeatedly entering the same data.

However, I then came across (pretty much by accident) this very useful site www.timetable2calendar.comScreenshot 2015-08-26 22.50.04 This site has been created by Andrew Caffrey (@MrCaffrey) and it works pretty smoothly to generate a calendar .ics file for each half term. I am very grateful that this site is out there as the .ics format isn’t the nicest really…..

Give a try, .ics files work with outlook and Google Calendar too.


Categories
A Level Teaching

Anscombe’s Quartet

A while ago I was introduced to this by Manan (@shahlock) and meant to blog about it then – only a 4 month delay.

In 1973 the statistician Francis Anscombe published this paper concerning the importance of computer visualisations of data.

Computer technology has moved on, but his main point about the importance of visualising data as well as calculating summary statistics is still true today.

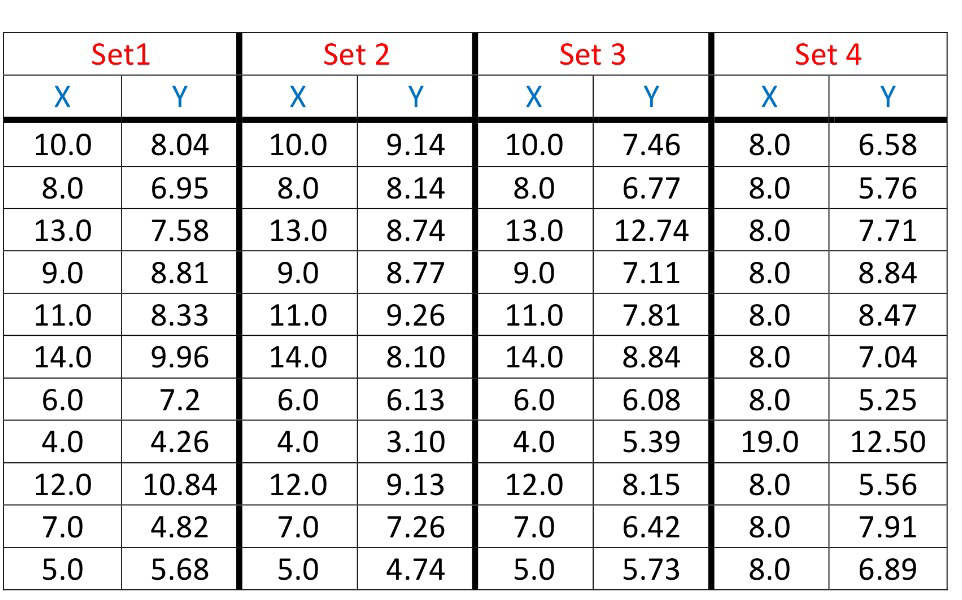
These 4 data sets, given below have many of the same common summary statistics:

  • Mean of X
  • Mean of Y (to two decimal places)
  • The Variance of X
  • The Variance of Y (to three decimal places)
  • Correlation between X and Y in each case (to three decimal places)
  • The linear regression line for each is \(\)y = 3.00 + 5.00x (to two and three decimal places respectively)

  
Being presented with just the sample statistics you could believe that the data sets are the same, or at the very least that the numbers are drawn from the same distribution.

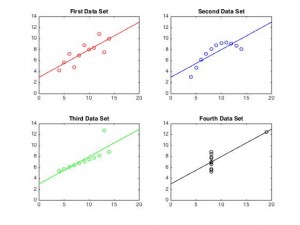
However when you plot them, it becomes clear that the data sets are very different.

anscombe


Quite often, presenting data visually seems to be overlooked as it is so easy to generate summary statistics but this classical example highlights the danger.

I’m planning on giving an exploration of this as an A-Level Homework at some point during the teaching of S1 this year, and have produced this sheet of prompts.

Categories
A Level Teaching

Partial Fractions

As I teach Further Maths I haven’t really considered how I would teach partial fractions, and normally just do them in my head without writing down any workings.

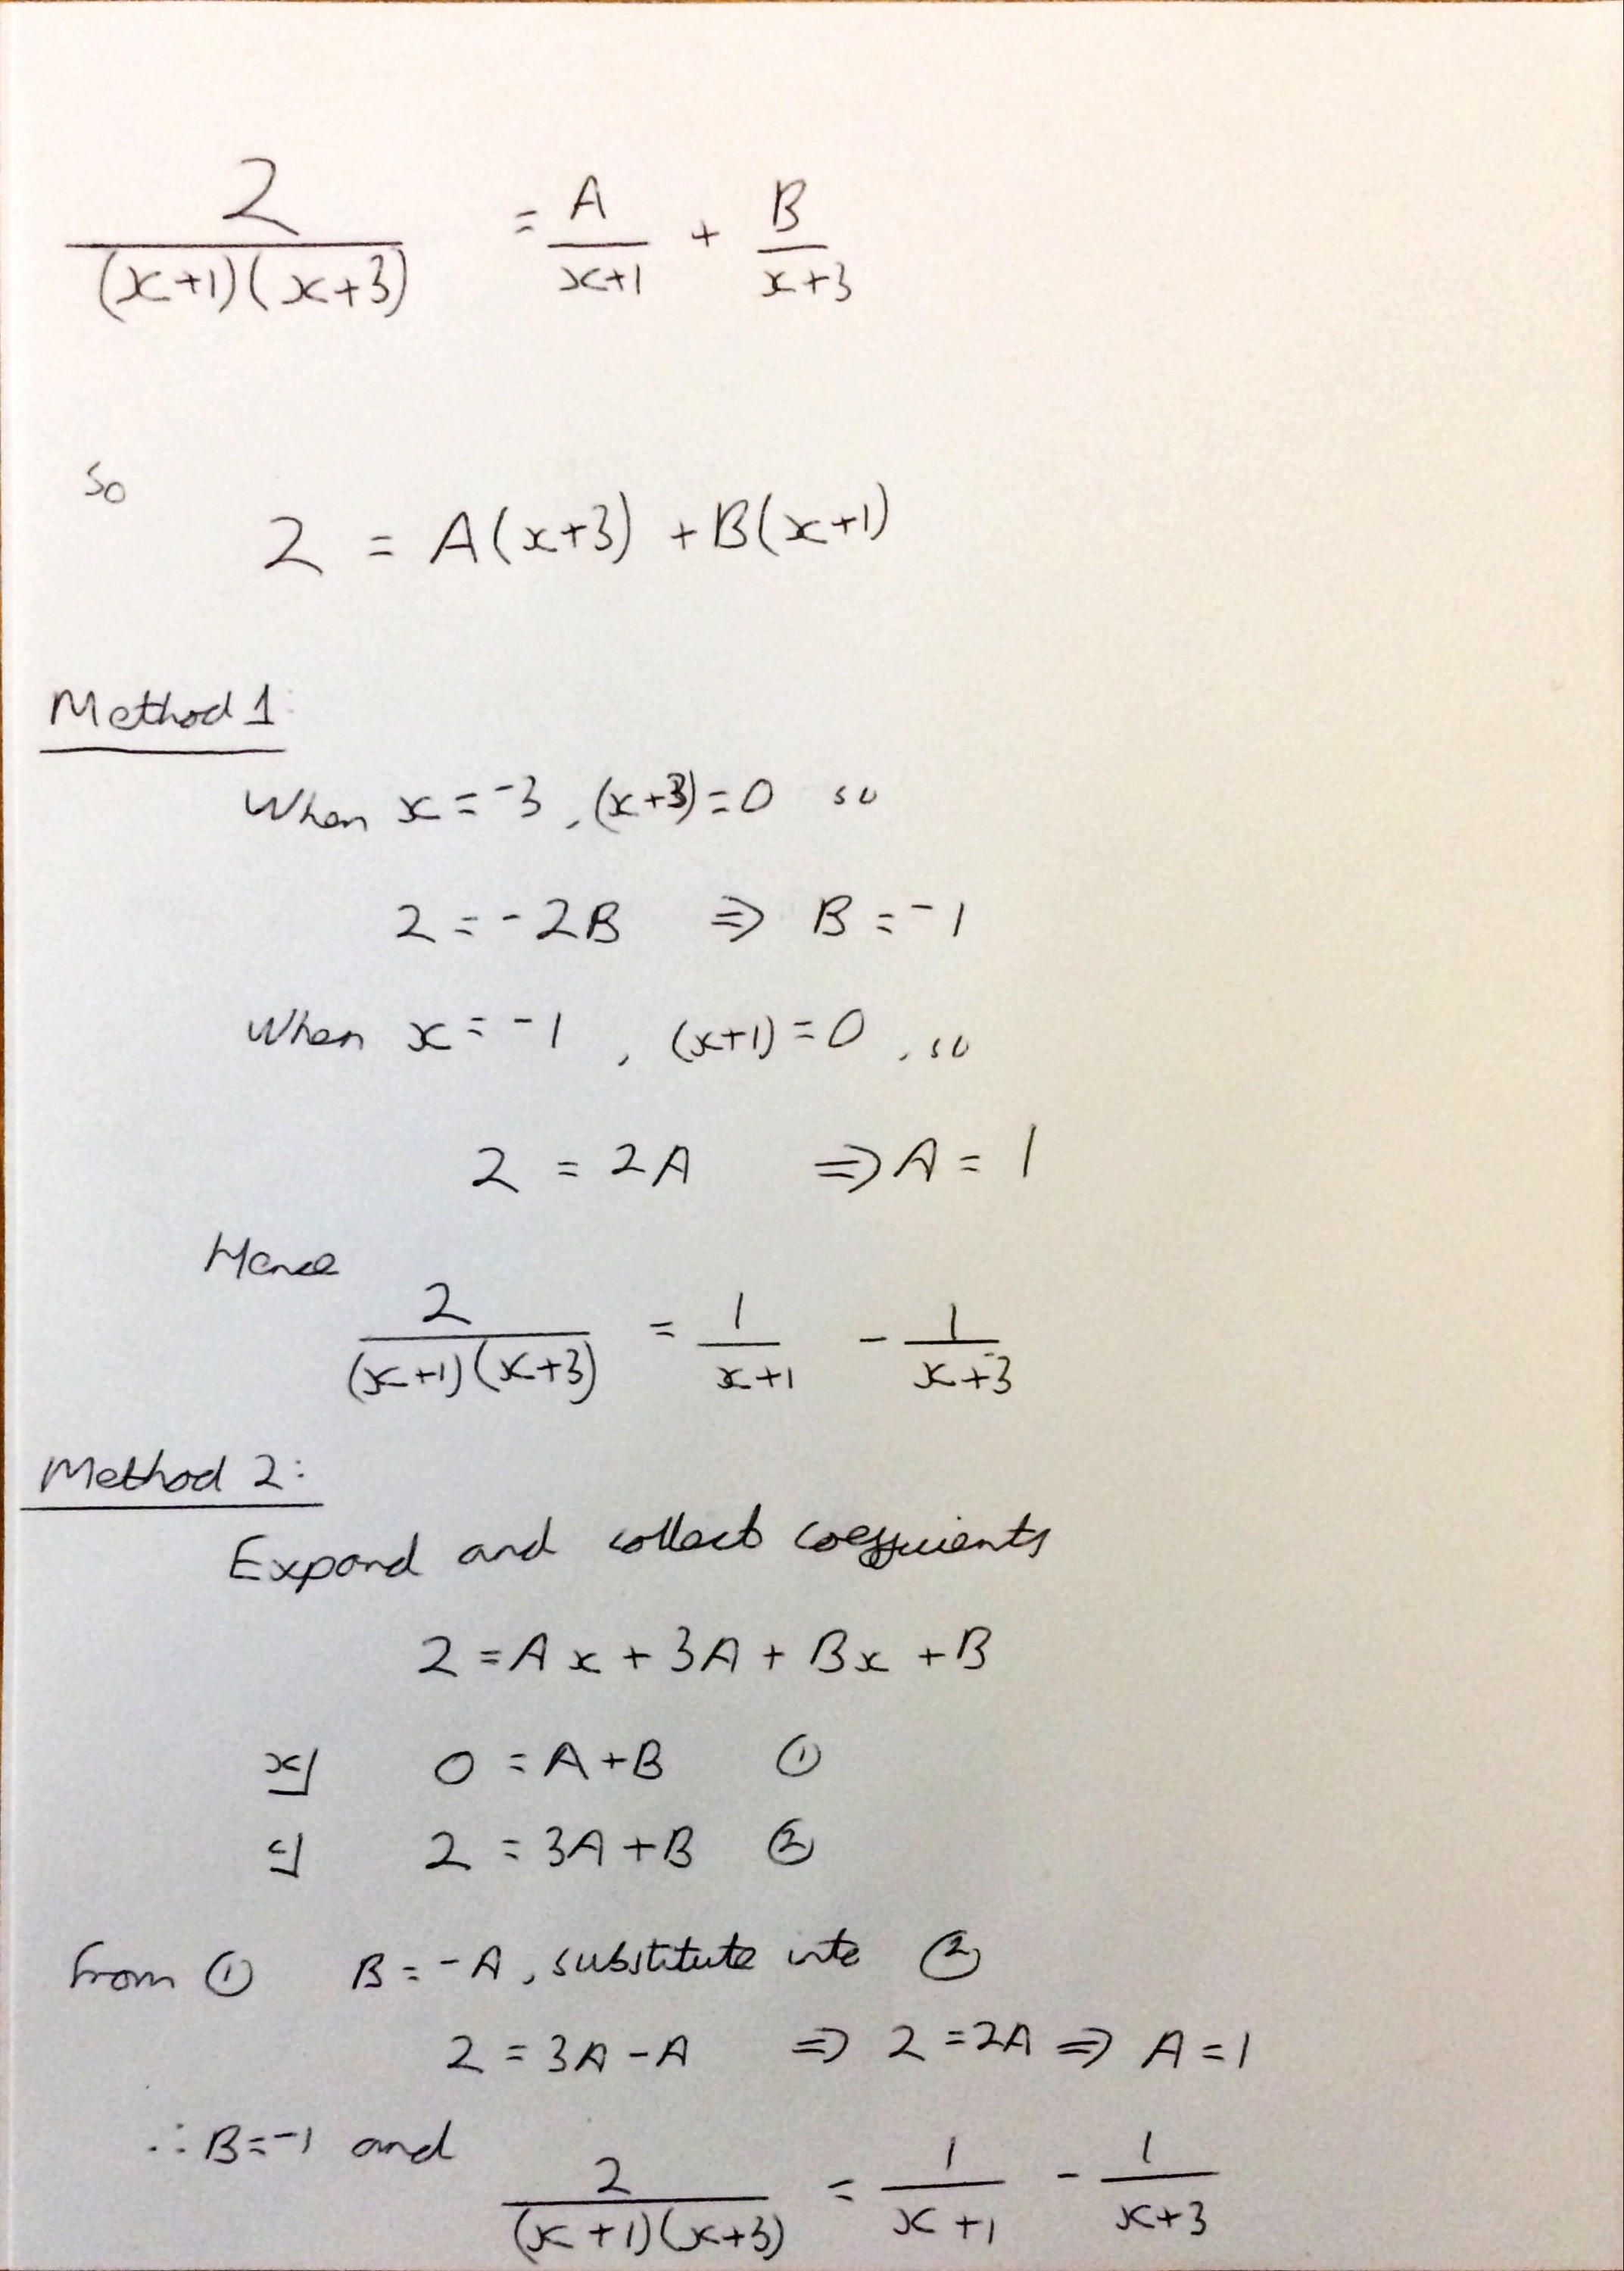
However, I have recently started providing some last minute tuition and one of the things they wanted explaining was partial fractions. To be honest I have forgotten how I was taught this, I have a feeling it was the “substitute different x values in to knock out terms” method. I went through two slightly different methods for the partial fraction shown below

  
Personally I prefer Method 1 but I think Method 2 would probably be better for the weaker students as it shows explicitly what is happening. 

How do other people teach this?

Categories
Teaching

My Mathematical Journey

I recently read Manan’s post and learnt that in the States April is Mathematics Awareness Month. Manan had written about his mathematical journey so I thought I would do the same.

I remember always liking maths and number stuff, but apparently for the first couple of years at primary school I wasn’t seen as being good at it because I didn’t put in a lot of effort. I can remember having very boring SPMG (I think that was the acronym) work books, where you had to do things like “colour 12 balloons” – I was never good at colouring (I still can’t really colour in between the lines to be honest) and so I just didn’t do it. I probably wasn’t the best kid to teach, as far as I was concerned I could count and I didn’t need to colour things to prove it. 

I loved primary school, and it was my Year 2 teacher who probably first made me “love” maths by giving me harder problems to solve than the rest of the class where I had to think more. This primary school also first introduced me to programming – first with logo and the big black “turtle” that moved on the floor and then with BBC BASIC on a BBC Micro and Acorn A3000 – though I didn’t know then that programming and maths would converge an become very important to me. 

Whilst I was at school, I was also lucky enough to have lots of time with my grandmother, who had been a maths teacher (mainly at the Royal College for the Blind) who set me maths problems and sent me coded messages to crack which I always enjoyed. I can also remember doing maths to calm down when I was stressed or apparently hyperactive. 

After having some good KS2 primary teachers I moved to secondary school, where I had a great teacher in Year 7, who again let me do work of my own choice most Friday lessons, including plenty of investigations. I still have a book on the history of Pi that he gave me when he left the school. People are often surprised that I didn’t enjoy the UKMT Junior Maths Challenges when I was at school – I didn’t really understand the benefit of them, and to me at the time they were puzzles that I didn’t really see the point of (I now think this is something that often needs addressing with KS3 students). I admit that I was probably seen as a bit of a geek at school – I once measureddhundred of blades of grass in an effort to determine if the grass around the school was all of the same type. I took my GCSE in Year 10 and then starter A Level Maths in Year 11. For me this was a good idea as it meant I could complete the A Level alongside starting Further Maths in Year 12 – this meant I avoided the problems of needing Year 13 content for Year 12 Further. My A level teacher was fantastic, always willing to help, or discuss things off the course. I appreciated how he always tried to show things from first principles, not just give us a result and then expect us to use it. At the end of Sixth Form I was pretty sure that following a maths degree I wanted to go and do a PhD – my uncle was (and still is) a lecturer in applied mathematics at Durham University – but in Pure mathematics, I was adament I didn’t want to do applied mathematics.

I went to study a 4 year Masters course at the University of Bath, in the end I chose a slightly odd mix of modules. I did a lot of Pure mathematics (group theory, number theory, measure theory etc) and lots of numerical methods, but very little fluids and mathematical modelling. This means I had a slightly odd background to choose (ironically) a PhD in applied mathematics. I had developed a love for the finite element method during some final year numerics modules. Such a simple idea but very powerful and infinitely less frustrating to analyse than finite difference methods with their taylor expansions! I applied to work with Paul Houston at the University of Nottingham, and following a brief meeting In the january of my final year was accepted to study under him and Andrew Cliffe. 

I moved to Nottingham and initially I was meant to be working on anisotropic adaptivity for fluid problems, but about half way through my first year II changed topics and focussed on applying the Discontinuous Galerkin method to the Neutron Transport Equation – this turned out to be significantly harder than we anticipated. A lot of time in my PhD was taken up programming in Fortran. At some point I will probably write about this more…. 

To cut along story short, during my PhD I discovered that I felt more rewarded when I was teaching others – either tutoring undergraduate, lecturing postgraduates from other faculties in statistics or going into schools and running GCSE or A Level revision sessions or doing outreach events – than I did when I was doing my own research. 

Following my PhD I applied for a School Direct place with the University of Nottingham. 

That’s a fairly short run down on how I ended up in teaching. I’d love to hear the stories of other UK based teachers.
Categories
Teaching Uncategorized

MathsHUBS and Steel Cables

I’ve been pretty slow writing about this but on Wednesday 11th March Mathshubs East Midlands West held this half term’s Secondary Curriculum Development Meeting. 

Aswell as being a chance to have a few cakes (I particularly like the granola bars topped with strawberry jam and seeds) Matilde Warden (@jordanvorderman), the maths lead for the East Midlands West Maths Hubs discussed improving reasoning in lessons.

She started by highlighting aspecs of the new national curriculum concerning mathematical reasoning and problem solving before we looked at a couple of problems from the nRich website, specifically the Stage 2 problem Fitted and the Stage 4 problem Steel Cables. The nice thing about these is that the nRich website (along with all the others in this collection) is that they show a few approaches to the problem that some students have tried. I had seen the Steel Cables problem before, but had never really considered different approaches before – the default to me was to find the quadratic nth term rule to predict all the terms. 

We also briefly looked at an article by Malcolm Swan, also available on the nRich website here. In the past, when doing problem solving lessons I confess that I normally spent only one lesson on them, and valued the thinking during the lesson and the verbalising of mathematics that happened with this. However I probably didn’t build on this terribly well to develop pupil’s problem solving approaches and build resilience. 

In the article, Malcolm suggested a two lesson approach where for the first lesson pupils work individually on a problem without help. At the end of the lesson you collect in the work and look through them (but don’t formally mark them!) so that you have an idea of how to move their thinking forward. Then, in the second lesson allow pupils to work in pairs to share their thinking, prompting them if necessary to move thier thinking forward. 

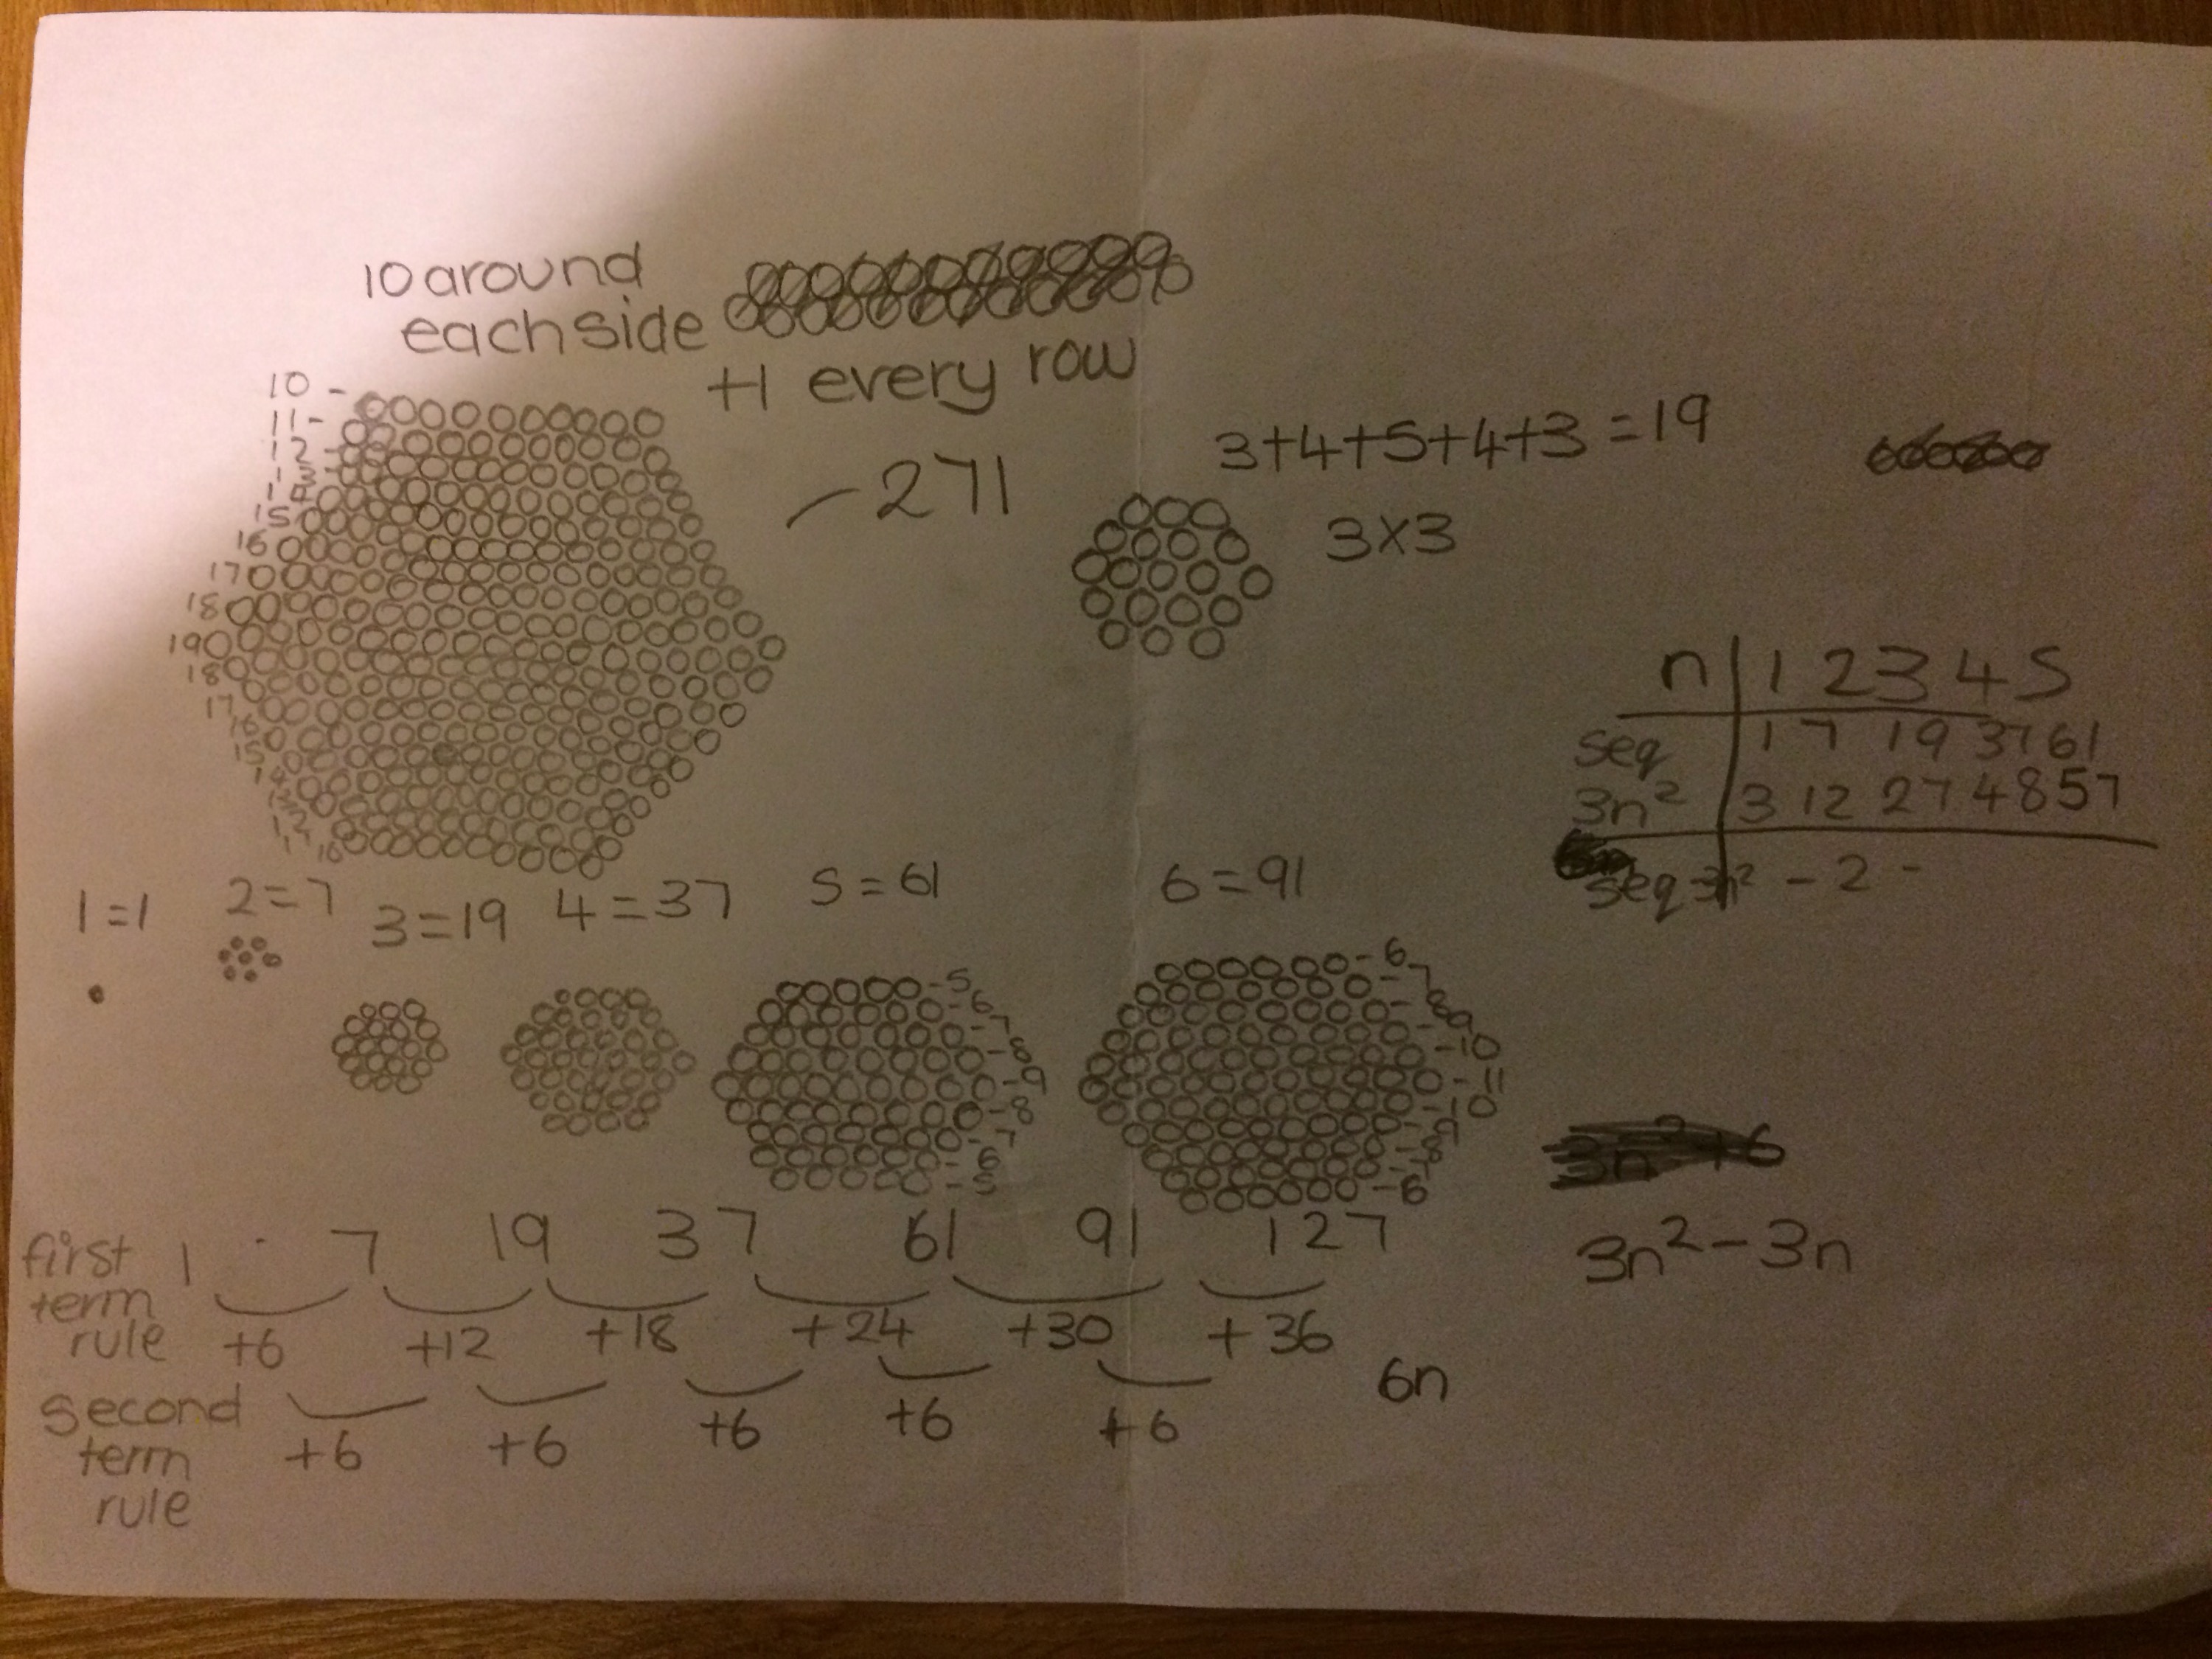
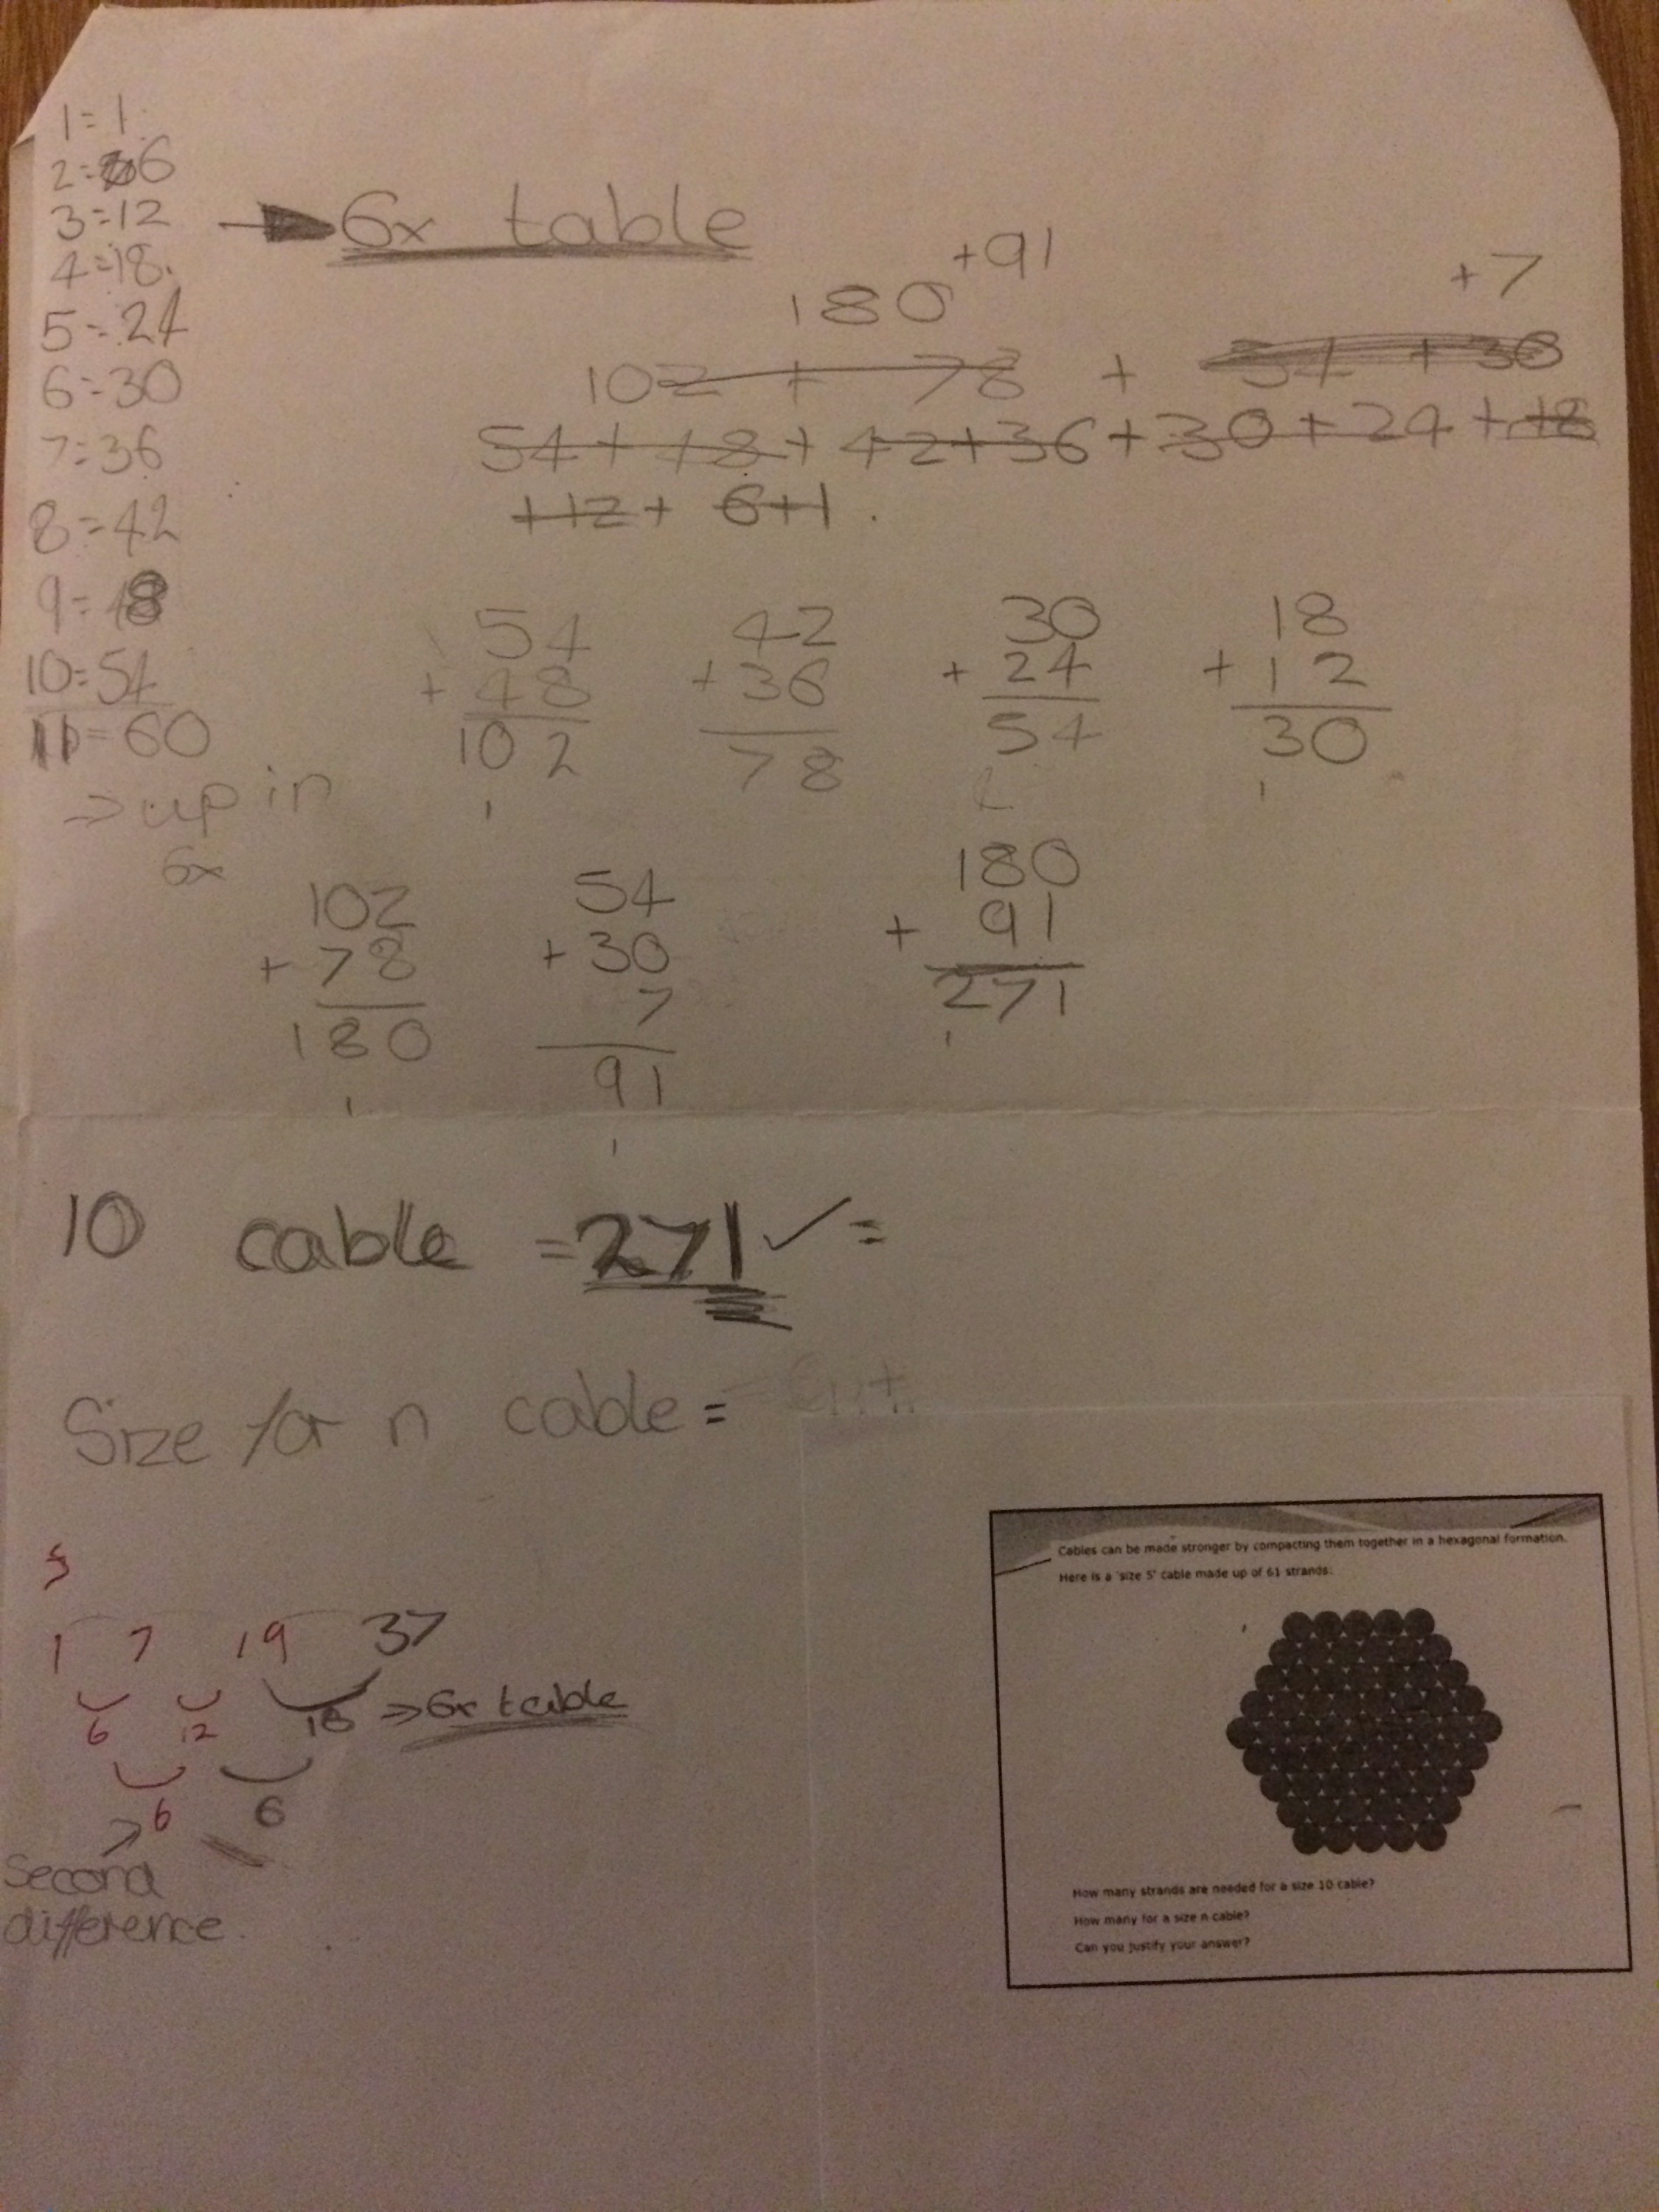
I decided to try this approach with one of my Year 8 classes and chose to look at the Steel cables problem – we had done quadratic sequences before Christmas so was interested to see if anyone would go along those lines. A couple of pictures of pupils work are below (the first is at the end of the second lesson, and the second piece isfrom a different student at the end of the first lesson)


Lots of different approaches were used, though drawing them out and counting methodically was a dominant approach. However the second picture shows the first person to answer the “how many strands in a size 10 cable” question, and she noticed that by counting in rings outward each new ring contained 6 more strands than the previous ring, and used this to work out the number of strands for a size 10 cable, before spotting that the pattern was related to the 6 times table. I also saw pupils spot the vertical symmetry of the cable and split the cable up into large and smaller triangles. Strangely though I didn’t see anyone split it up into quadrilaterals like one of the sample pieces of work on the nRich website. 

Malcolm also suggests showing sample work to pupils and getting them to critique it, and develop it further. Unfortunatey I didn’t have time to do this, though this is something I intend to do in the future.

He ends his article by suggesting that teachers let pupils see their reasoning and tackle a problem unseen oon the board. This is something I try to do every lesson with my sixth formers. I enjoy tackling a question that I haven’t though about before, I think it is important for pupils to see me struggle with arithmetic sometimes and try iincorrect approaches and double back on myself. After all, making mistakes is really what maths is about.

Categories
Teaching

Pentominoes

Since starting teaching I’ve noticed that a lot of teachers like to use pentominoes for various activities.
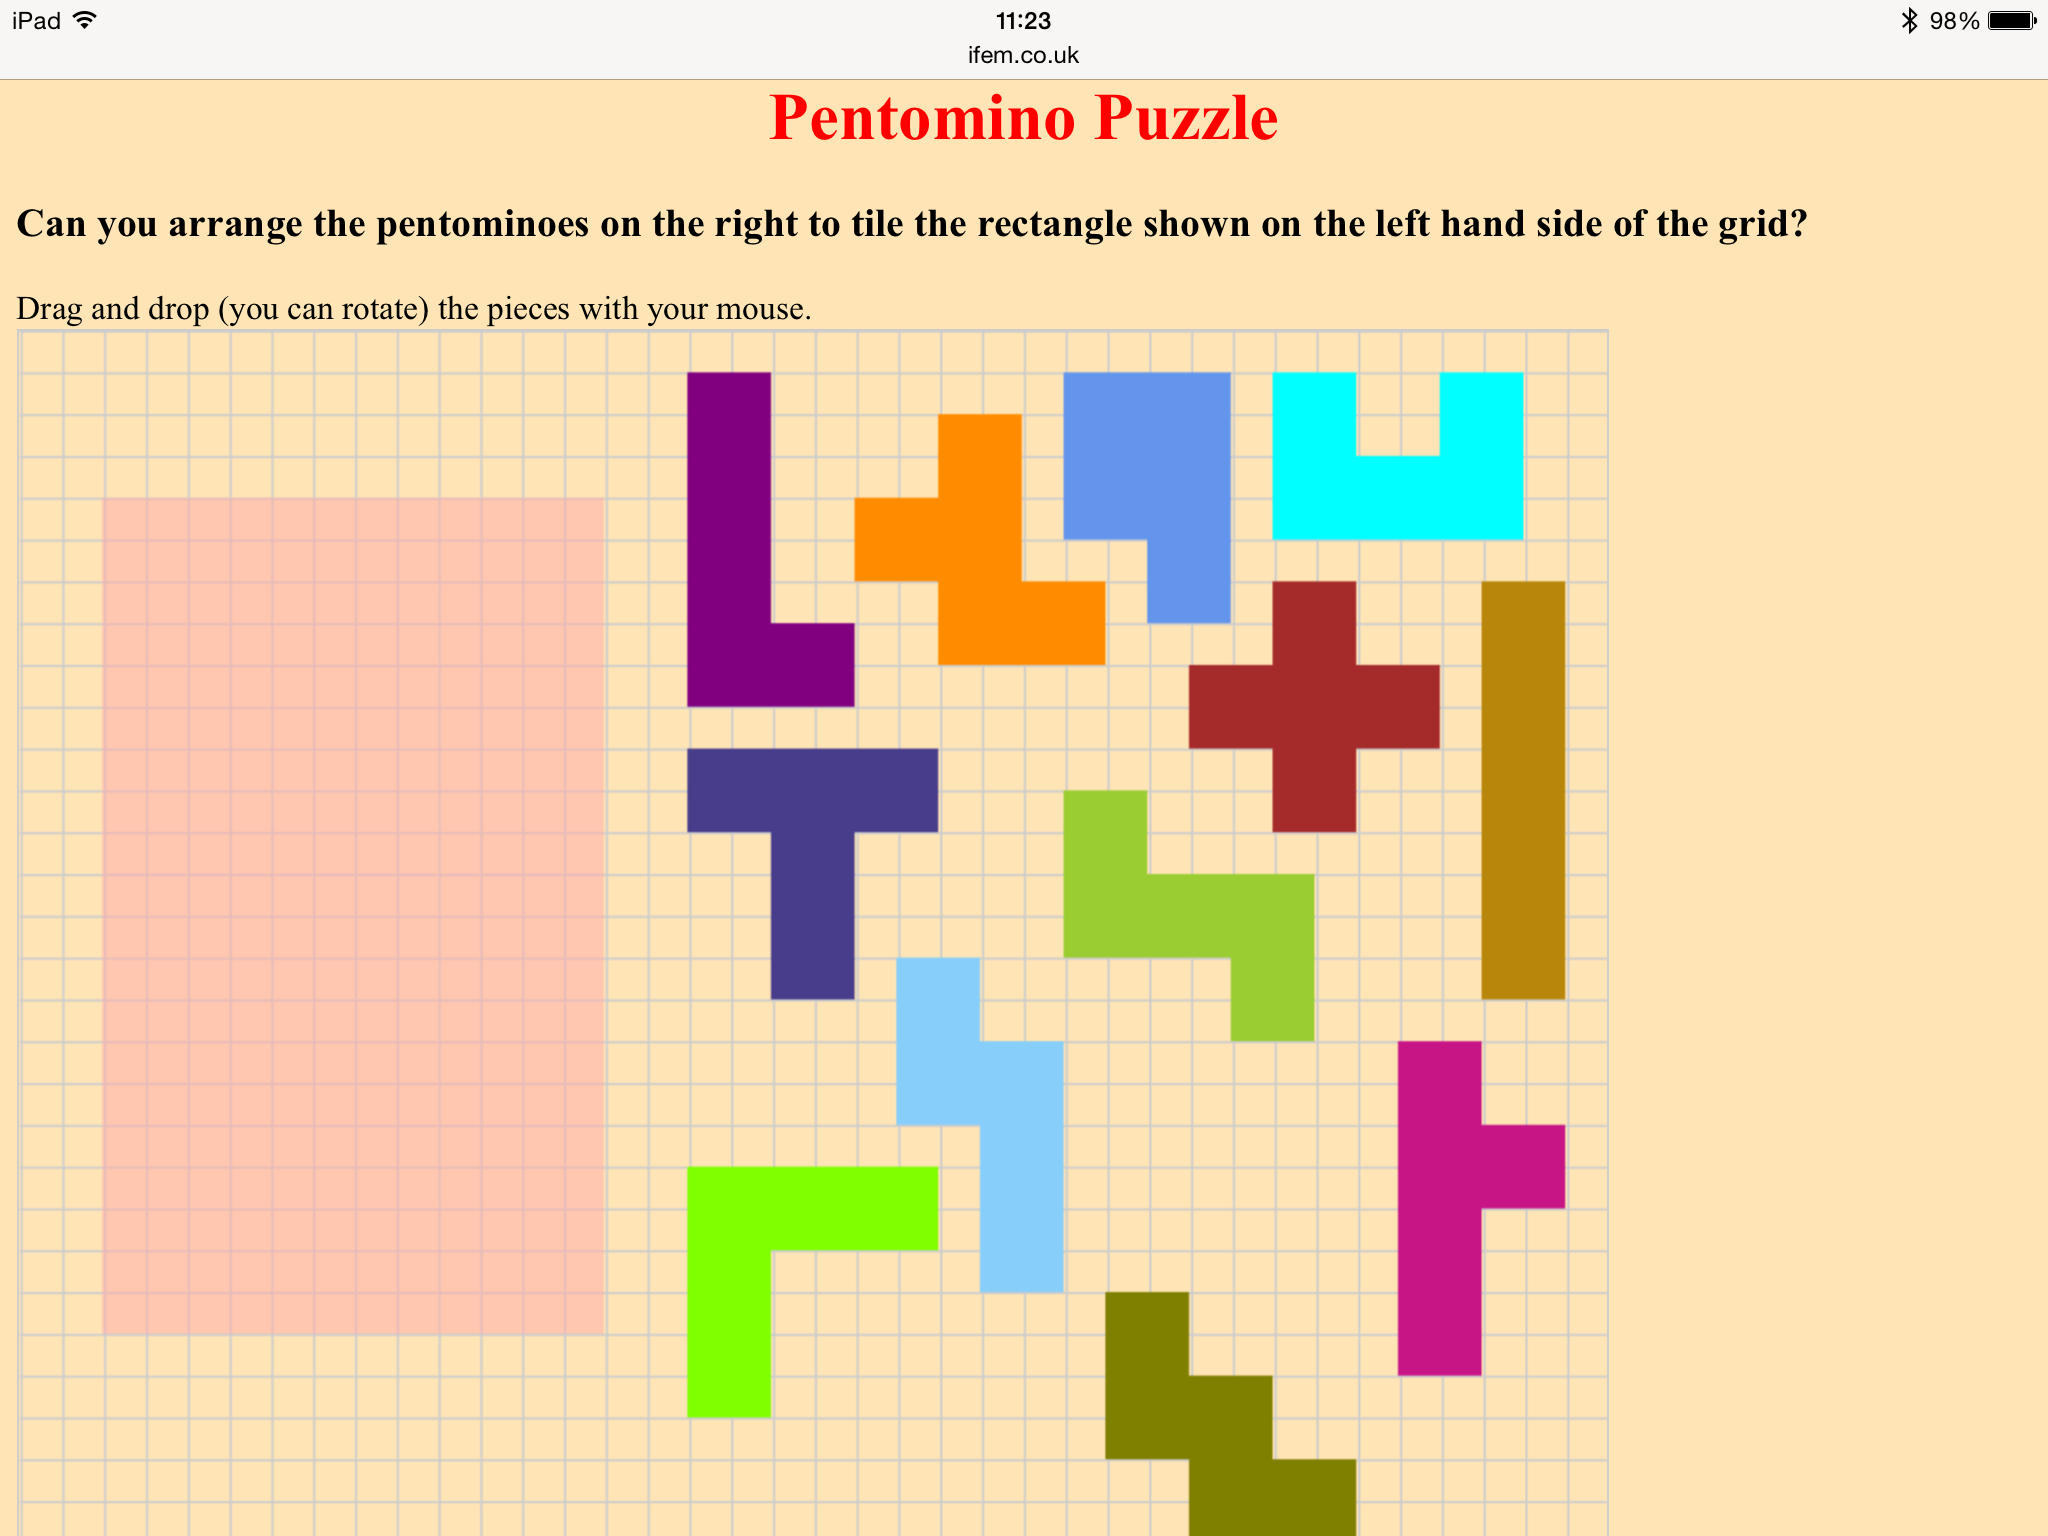
As a way of learning and practicing some Javascript and getting to know the Fabric.js (@fabricjs) canvas library I have produced a pentomino arranging exercise, a screen shot is shown below:

(null)

You can move and rotate the pieces with a mouse (to rotate use the rotation handle that appears when you click on a piece), it should also work on touch devices.

Feel free to have a go here if you aWnt. The objective is simple – rearrange the pentominoes to tile the rectangle on the left hand side of the screen.

Categories
A Level Software Teaching

Geogebra and Further Maths

This week I had an observed lesson, where the remit was that I do something risky that I perhaps wouldn’t have done otherwise.

My Year 12 Further Maths class had been selected as my observation lesson – I found thinknig of something risky to do with them harder than if it had been any other group. They are used to me doing odd things, that are a bit off the wall with them and they always respond well. In the end I decided to use ICT and try to get them to do some independent discovery work.

We have just started the coordinate geometry section of FP1 (Edexcel) and wer due to look at the parabola this week. I have used GeoGebra a bit in the past but I had never created my own geogebra worksheet before and this seemed like the perfect opportunity.

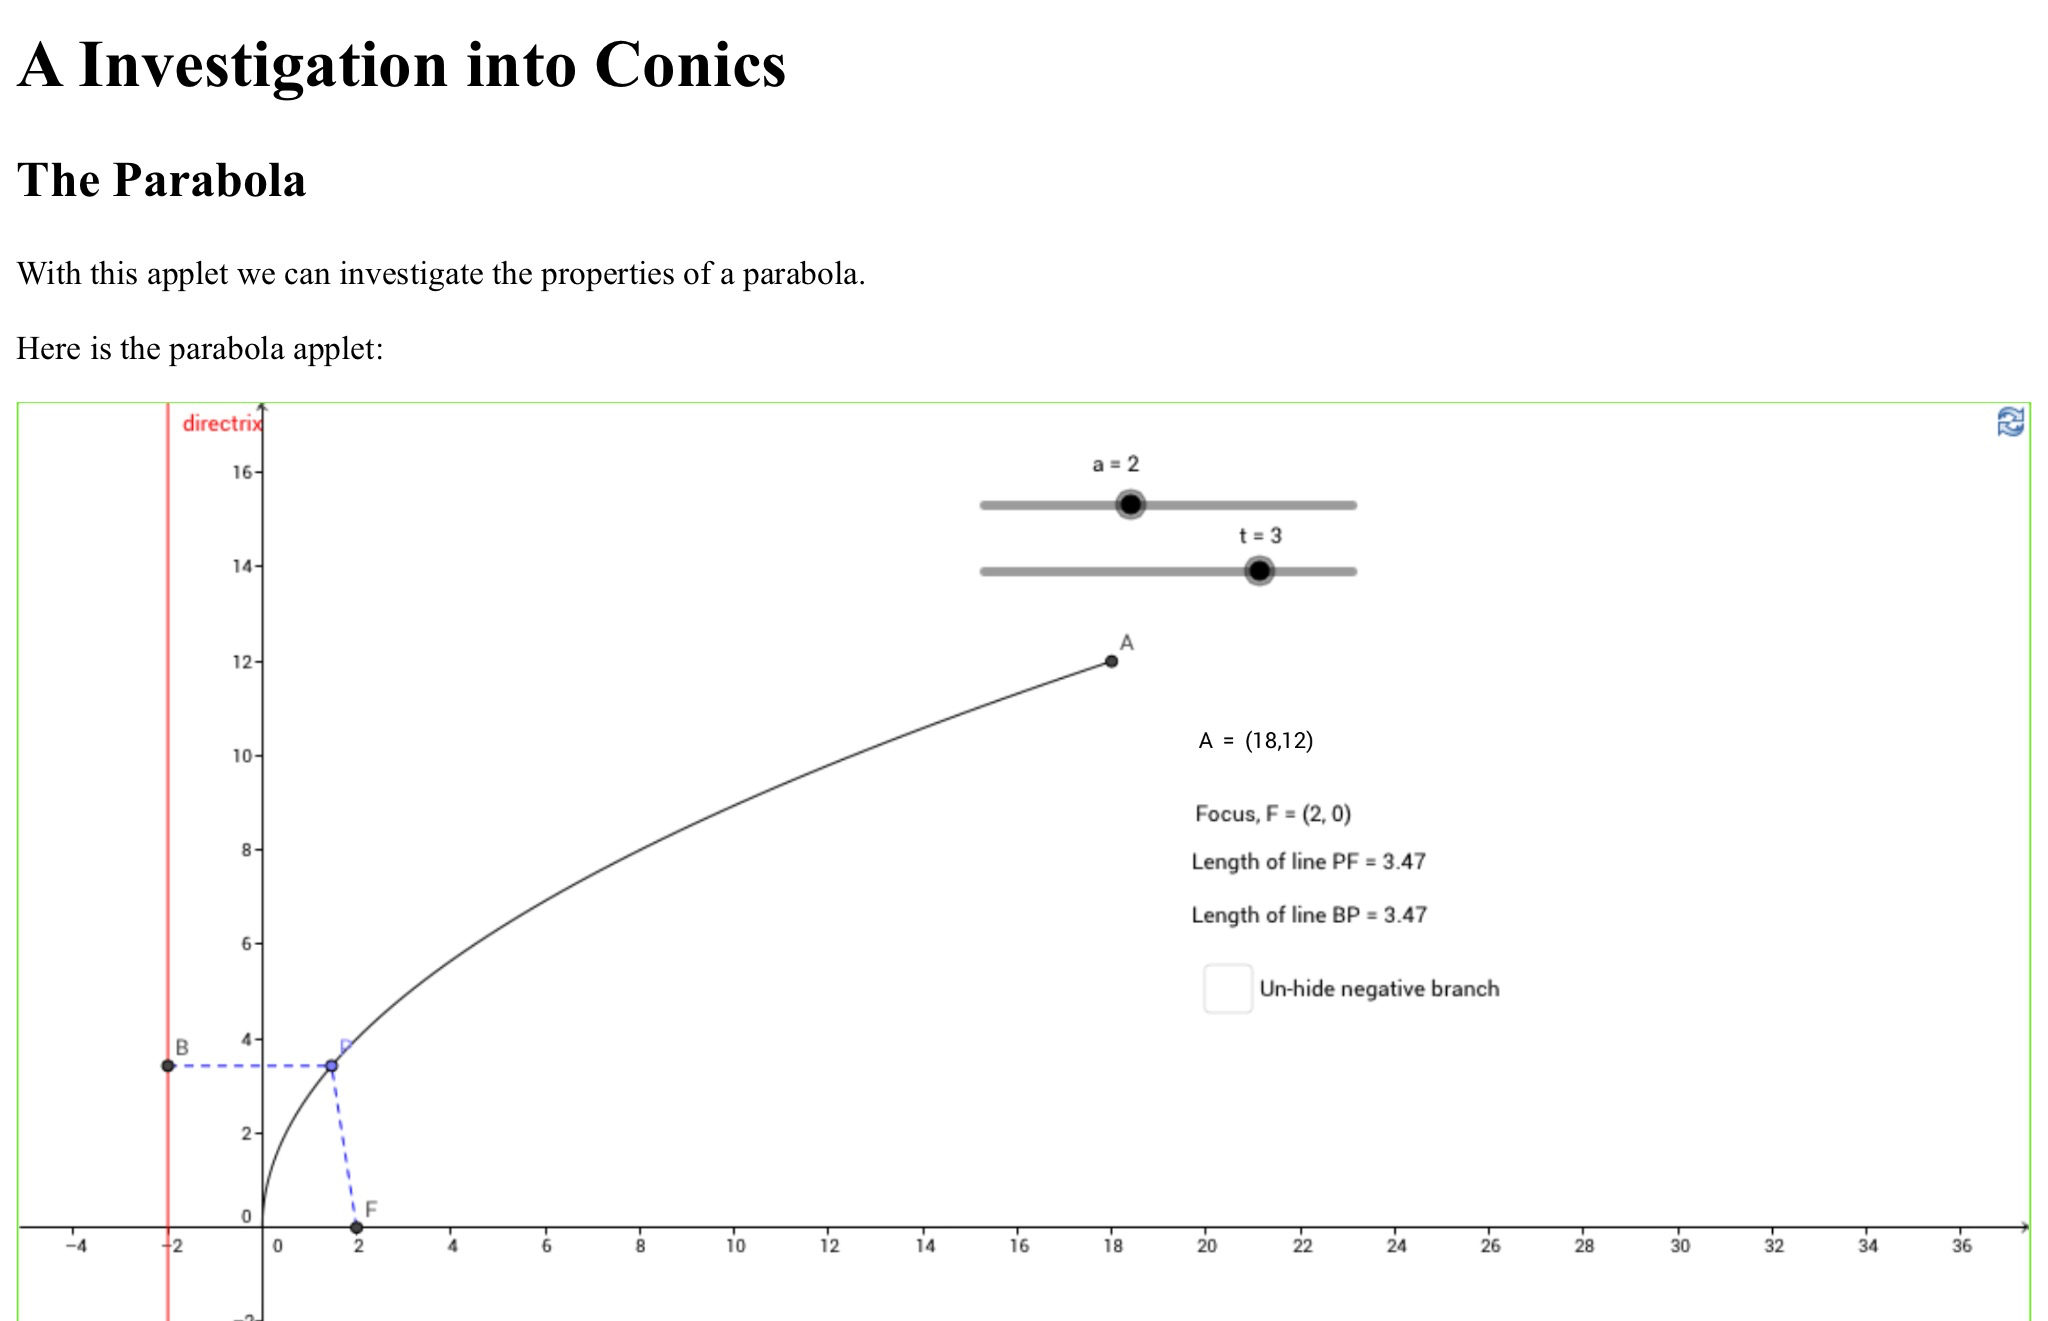
So, one evening I installed the latest version of GeoGebra on my MacBook, signed up for a GeoGebra Tube account and set about creating a worksheet where students would be able to explore the parametric equations of a parabola and the focus directrix property for themselves. I then uploaded the file to GeoGebra Tube, and got the content ID from the embed option. As I didn’t want to rely on GeoGebra being installed / working on all the computers in my teaching room I decided to upload a html version to my own webpage. The GeoGebra tean have made this really easy by poviding a javascript library that you can just source at the top of your html code and then a really simple API to embed a dynamic worksheet in your webpage. They have provided examples of how to do this.The web apps for the Parabola and Hyperbola that I created are here. On loading the page you should see a screen that looks like this:

I then wrote a sheet with some questions to guide the students’ explorations here, these questions should prompt them to derive the parametric equations of the parabola and notice the focus-directrix property. It is significantly harder to answer the questions concerning the hyperbola – I saw these as hard extension questions.

All of my class seemed to enjoy using these and engaged well with the work. Walking round the room I also saw some great responses to questions. 

To produce the worksheets, upload to GeoGebra Tube and then host on my website took in total about 2 hours which I don’t think is bad for a first time. 

My intention is to use GeoGebra moe across the keystages, any worksheets I create I will share through my website as well as GeoGebra Tube. The original GeoGebra files (in case you want to modify them) are here (parabola) and here (hyperbola). I will also be adding a worksheet for the Ellipse to the webpage later too. 

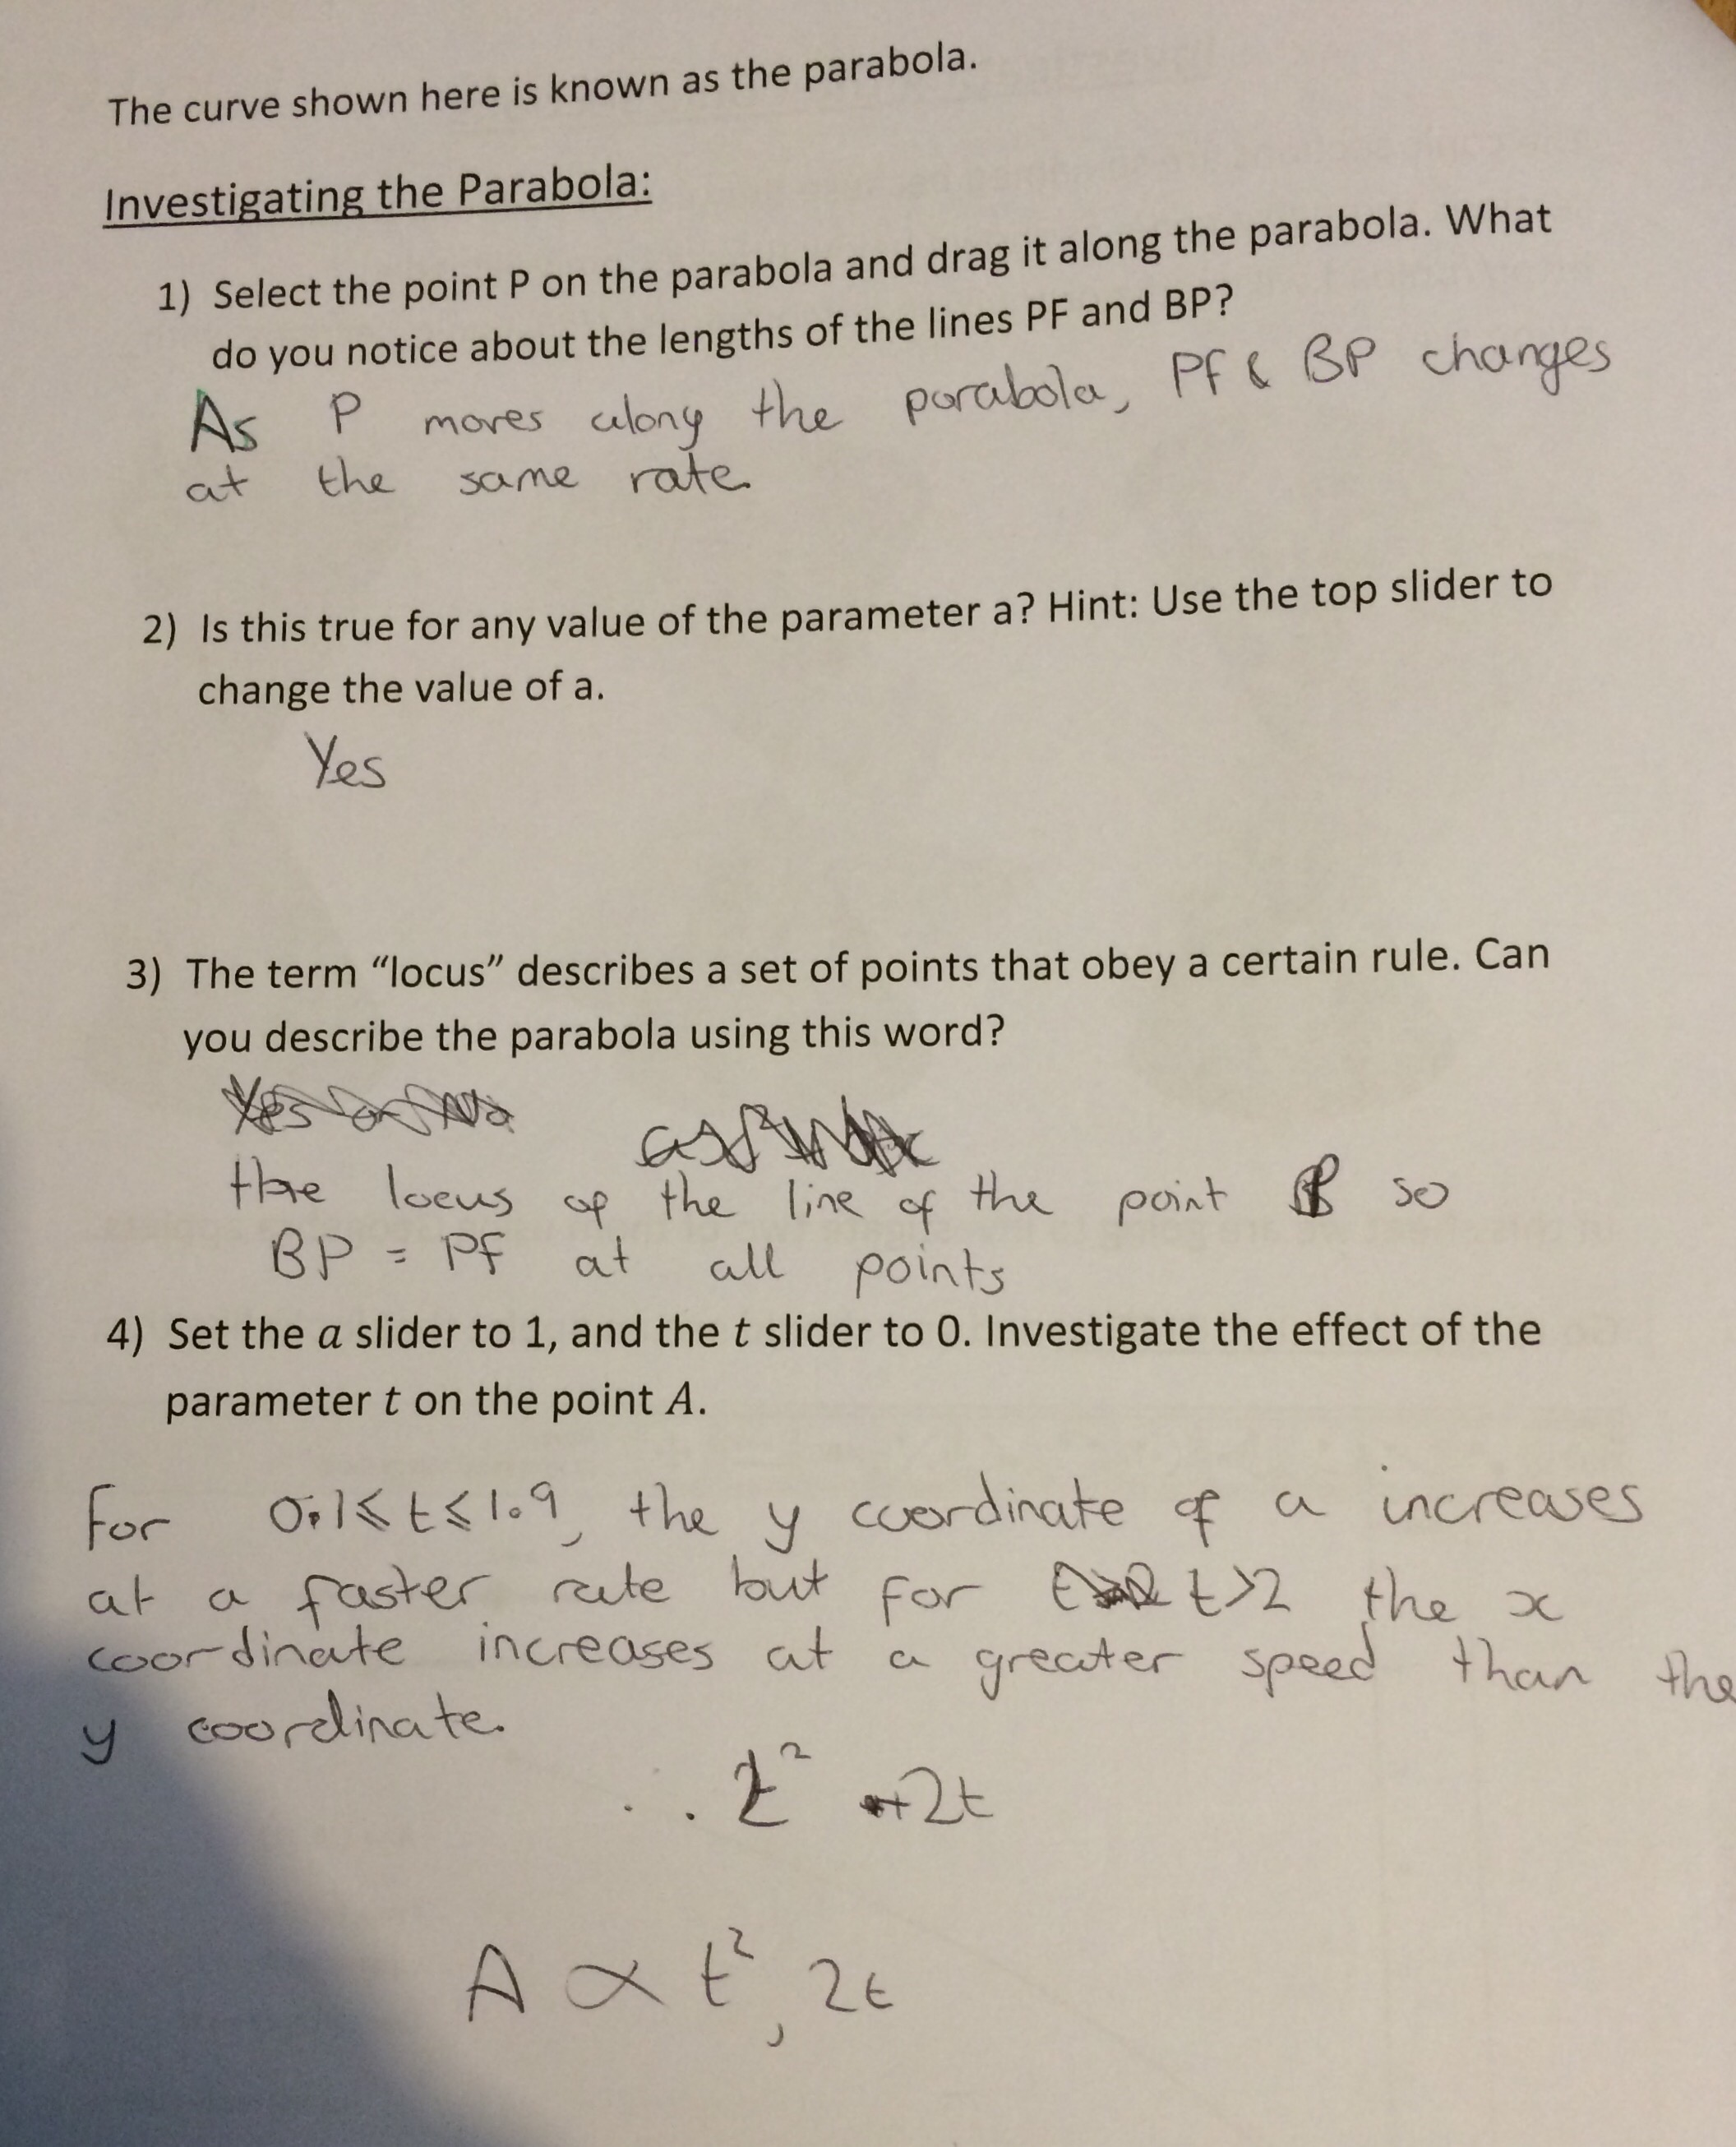
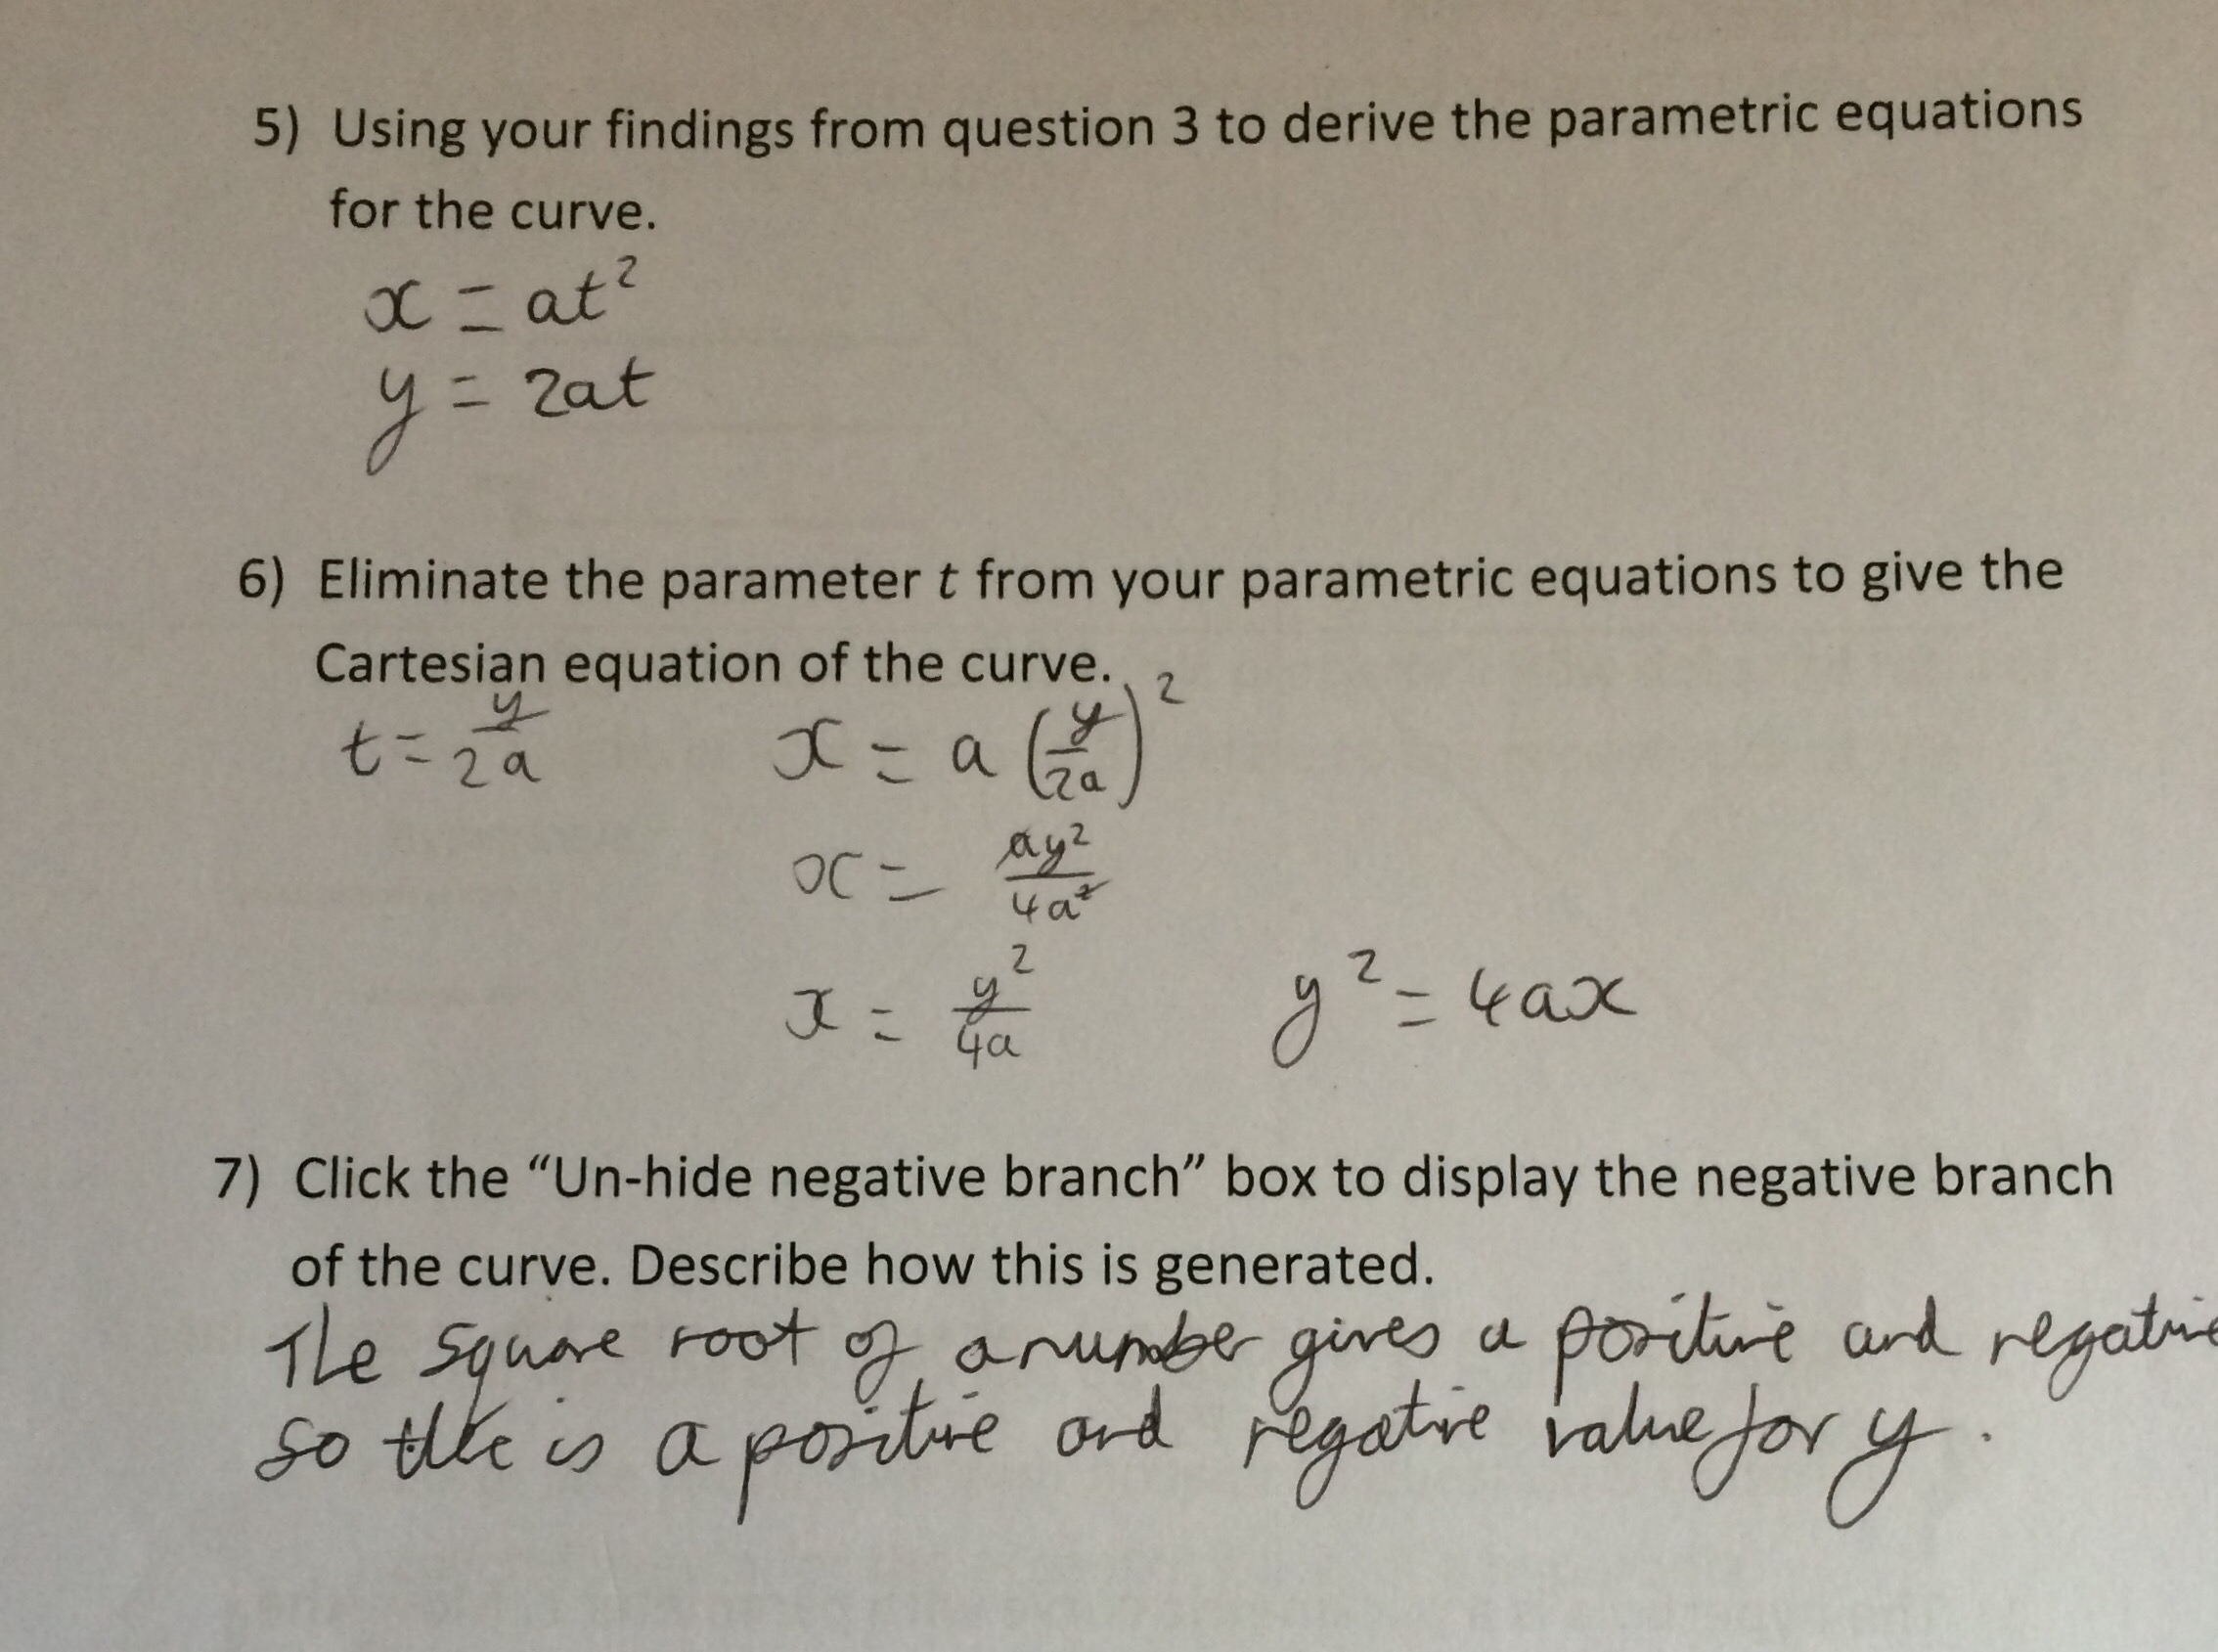
Some examples of students responses to the questions are shown below:


Update: Please be aware that for the web applets to load there has to be communication with the GeoGebra website, so make sure that is not on your schools block list. 

Categories
Problems Teaching

My First @solvemymaths Problem

This morning I woke up to the problem shown below by the excellent @solvemymaths on my Twitter feed.

(null)
I’ve always been very lazy and not properly solved any of his puzzles before, partly because I have a strange irrational fear of geometry. Wanting to conquer this fear I thought I’d have a quick go at this.
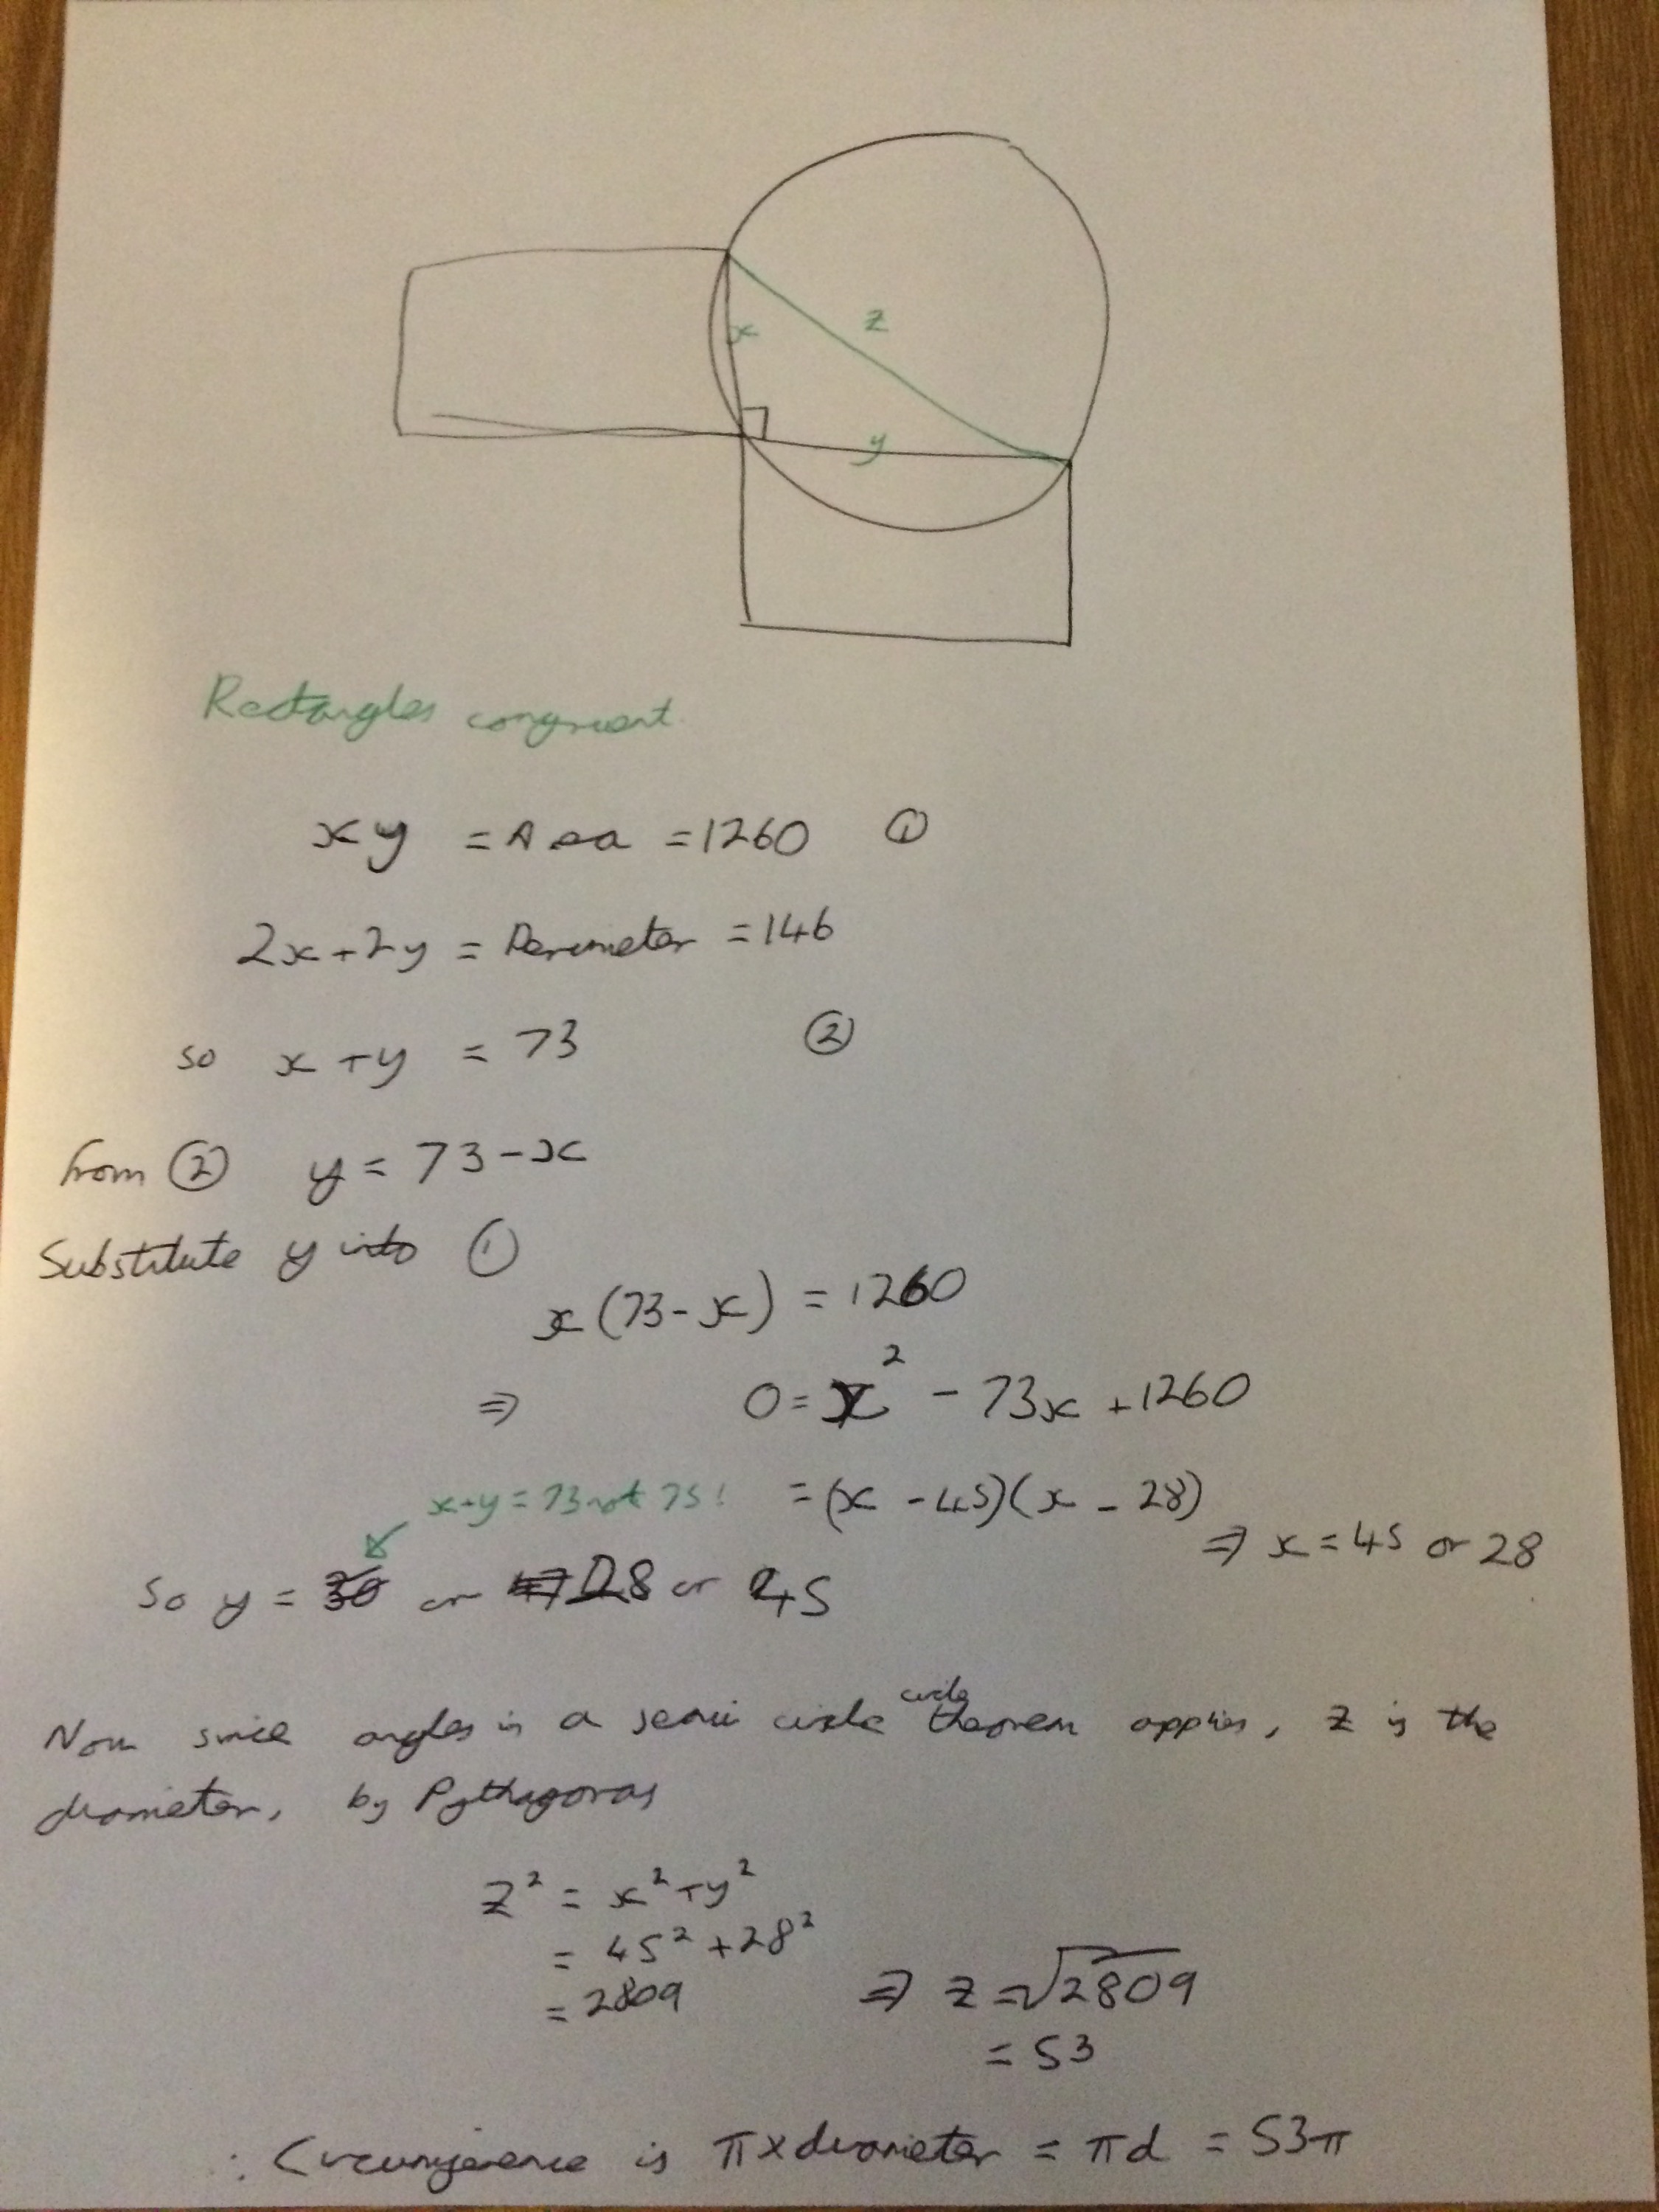
It turned out to be quite straight forward really (although I did make a silly mistake and got an original answer that seemed odd). My workings with my mistake are shown below:

(null)