Categories
Uncategorized

Birth Of A Theorem

Cedric Villani’s book “Birth of a Theorem” has recently been released and received positive revies, such as this one by Hannah Fry. I had been dubious about buying this book due to the apparent high level mathematical content of parts of it, but about 3 weeks ago BBC Radio 4 featured it as their book of the week – after hearing the extracts I have ordered the book. 

Julien Rhind-Tutt’s reading of extracts from Villani’s book is very engaging – though I think it has perhaps lost something by not being read by Villani. The episodes are available for another week or so here –  I’d encourage you to listen if you can.

Cedric Villani is a Fields Medal winning (in 2010) French mathmeatician, who works primarily on mathematical physics. The Fields Medal is highly prestigious as it is only awarded every 4 years and only to mathematicians under 40. He won the Fields medal for his work on non-linear Landau Damping and the Boltzmann Transport equation, in 2012 he wrote a book, “Théorème Vivante”,in French, describing the road to the proof of his theorem and it is this which has been translated into English and published as “Birth of a Theorem” in 2015.

Villani gives a really nice insight into the world of a mathematician, and I could definitely recognise the panic he felt when there was no tea available – “Panic! Without the stimulating leaves of camelia sinesis I couldn’t possibly face the hours of calculation which lay in store”, he then goes on to describe breaking into Princeton to procure some tea. In the first episode he paints a nice picture of how consuming mathematics can be – “While the children excitedly open their Christmas presents, I’m hanging exponents on functions like balls on a tree and lining up factorials like upside down candles”. He also describes his wife being being taken aback seeing his “face contorted by ticks and twitches” as he thought about the problem he was working on over dinner. My wife says that in the final year of my PhD she would often have to say things to me more than three times because I would just zone out into a world of my research – I think it can be very hard being with a mathematician at times! It is certainly easy to feel for him when he describes receiving the rejection email from Acta Numerica – if you have spent countless hours on a problem, to have the paper rejected is crushing.

On his website there is an introduction to Boltzmann like transport equations in his survey paper “A Review of Mathematical Topics in Collisional Kinetic Theory” despite being an introduction it is still incredibly dense. I’ve studied a particular version of the Boltzmann equation – The Neutron Transport Equation – and a few pages in I am struggling to follow this easily. I think I would have to expend an awful lot of time in order to be able to understand the mathematical parts of his book. Indeed, if I ever could, it is likely that only a few hundred mathematicians in the world understand his and Clément Mouhot’s proof!

Cedric Villani also appered on Start The Week on 9th March 2015, a podcast of which is available here which is also worth spending the time to sit down and listen to properly.

Categories
Uncategorized

Nottingham Maths on BBC Radio 4 Today

Yesterday morning on my way to school I had a nice surprise and heard Ivan Fesenko on BBC Radio 4 today talking about a new £2.3 million grant that academics at Oxford University and The University of Nottingham have won to tackle some of the greatest unsolved pure mathematics problems. 

The short interview is well worth a listen here (start 1 hour 222 minutes in). The team lead by Professor Ivan Fesenko at Nottingham will look at ways of tackling the generalized Riemann Hypothesis and the Birch and Swinnerton-Dyer conjecture. Both of these are Clay Millenium problems, and more information is available on the Clay Mathematics Institute website. They are obviously incredibly hard…..

I really liked Ivan’s description of mathematics as a “very large old oak tree, with many, many branches still developing. Most mathematicians are working and sitting on one of those new branches.”

Categories
Teaching Uncategorized

MathsHUBS and Steel Cables

I’ve been pretty slow writing about this but on Wednesday 11th March Mathshubs East Midlands West held this half term’s Secondary Curriculum Development Meeting. 

Aswell as being a chance to have a few cakes (I particularly like the granola bars topped with strawberry jam and seeds) Matilde Warden (@jordanvorderman), the maths lead for the East Midlands West Maths Hubs discussed improving reasoning in lessons.

She started by highlighting aspecs of the new national curriculum concerning mathematical reasoning and problem solving before we looked at a couple of problems from the nRich website, specifically the Stage 2 problem Fitted and the Stage 4 problem Steel Cables. The nice thing about these is that the nRich website (along with all the others in this collection) is that they show a few approaches to the problem that some students have tried. I had seen the Steel Cables problem before, but had never really considered different approaches before – the default to me was to find the quadratic nth term rule to predict all the terms. 

We also briefly looked at an article by Malcolm Swan, also available on the nRich website here. In the past, when doing problem solving lessons I confess that I normally spent only one lesson on them, and valued the thinking during the lesson and the verbalising of mathematics that happened with this. However I probably didn’t build on this terribly well to develop pupil’s problem solving approaches and build resilience. 

In the article, Malcolm suggested a two lesson approach where for the first lesson pupils work individually on a problem without help. At the end of the lesson you collect in the work and look through them (but don’t formally mark them!) so that you have an idea of how to move their thinking forward. Then, in the second lesson allow pupils to work in pairs to share their thinking, prompting them if necessary to move thier thinking forward. 

I decided to try this approach with one of my Year 8 classes and chose to look at the Steel cables problem – we had done quadratic sequences before Christmas so was interested to see if anyone would go along those lines. A couple of pictures of pupils work are below (the first is at the end of the second lesson, and the second piece isfrom a different student at the end of the first lesson)


Lots of different approaches were used, though drawing them out and counting methodically was a dominant approach. However the second picture shows the first person to answer the “how many strands in a size 10 cable” question, and she noticed that by counting in rings outward each new ring contained 6 more strands than the previous ring, and used this to work out the number of strands for a size 10 cable, before spotting that the pattern was related to the 6 times table. I also saw pupils spot the vertical symmetry of the cable and split the cable up into large and smaller triangles. Strangely though I didn’t see anyone split it up into quadrilaterals like one of the sample pieces of work on the nRich website. 

Malcolm also suggests showing sample work to pupils and getting them to critique it, and develop it further. Unfortunatey I didn’t have time to do this, though this is something I intend to do in the future.

He ends his article by suggesting that teachers let pupils see their reasoning and tackle a problem unseen oon the board. This is something I try to do every lesson with my sixth formers. I enjoy tackling a question that I haven’t though about before, I think it is important for pupils to see me struggle with arithmetic sometimes and try iincorrect approaches and double back on myself. After all, making mistakes is really what maths is about.

Categories
Uncategorized

Maths Carnival 120

The great site The Aperiodical maintain a monthly blog carnival, that is hosted,in turn, by other blog writers. This month the Carnival of Mathematics has been curated by Manan Shah over at the site Math Misery

I am privileged to have had two posts of mine included in this edition. The first concerns approximations to \(\pi\) and is available here, the second is my post about using Geogebra for self guided learning in FP1 when looking at the conic sections.

Issue 120 of the Carnival of Mathematics is here and well worth a read – I didn’t realise 120 was an abundant number! Manan has picked out some great reads, including Stephen Cavadino’s (@srcav) work through of a nice problem that eventually boils down to finding the maximum of a quadratic and a discussion of the convergence speed when computing Khinchin’s Constant by John D. Cook (@JohnDCook). 

Head over and read The Carnival of Mathematics at Math Misery and check out the rest of Manan’s blog too – there’s always something of interest there!

Categories
Uncategorized

#mathsconf2015

I had a great Pi day yesterday at The National Mathematics Teachers Conference, organised by La Salla Education (@LaSalleEd) interacting with many other teachers from around the UK. My only regret is that I didn’t stay the night before, it sounds like a lot of fun was had.

The day got off to a good start with breakfast pastries and coffee, I’m sure I had more than I should have done but they were very tasty! After the welcome from Mark McCourt came the welcome from Andrew Taylor of AQA (@AQAMaths). He focussed on problem solving and emphasised that despite what you may think from the media at the moment problem solving is still an important component of the AQA assessment materials. He explained how the problem solving focus has been around for a long time and highlighted some materials that AQA developed with Leeds University’s Assessment and Evaluation unit to support the teaching of problem solving some years ago. I wasn’t aware of the “90 maths problems” resource and I’ve had a quick flick through the extract they provided in print form – I particularly like the “Javelin B” and “PQR” problems. I’ll be downloading the full resource from AQA’s All About Maths site and having a proper look. 

After this we had the presentation from Dr Vannessa Pittard of the DfE – for those of us at LaSalle’s last conference this was pretty dull as the presentation, I am sure, was exactly the same. But as @MrReddyMaths pointed out, this conference was much bigger so there was a large section of the audience that this presentation may have been useful to. I’m ashamed to say that at the time I didn’t consider this….. The speed dating was interesting as usual, though unfortunately I can’t remember who I actually spoke to 🙁

Session 1

After coffee, with some surprisingly nice frangipane cake bites, it was time for session 1. Unfortunately Andrew Blair (@inquirymaths) whose workshop I was looking forward to attending was unable to be there due to illness. Because of this, the session was replaced by a last minute session ran by the memory expert David Thomas of Sticky Studying. David was a fantastic, very entertaining speaker but I can’t see myself using techniques like these memory visualisation things in my classroom

The dividing fractions one I particularly don’t like as this doesn’t help understanding. Just memorising things and methods is very different to what I am beginning to call “conceptual memory” – I’m sure this phrase has been used before…..

Before the session I had always been very dismissive of the idea of writing a journey/story to remember a list of things. I think this is perhaps because I didn’t have problems remembering  things at school and thought this meant that there was just more things to remember. However, at the beginnig of the session we were asked toremember  20 random objects and embarrassingly I only remembered 5. At the end we were asked to remember another list of 20 objects by writing a journey and I remembered all 20. Whilst this wasn’t a totally fair comparison (the first list was spoken to us and the second was written), this session has at least made me consider whether these kind of memory techniques could benefit students who struggle to remember.

Maths TweetUp

During the extended lunch break we had a very enjoyable TweetUp organised by Bruno Reddy,Julia Smith,Mel Muldowney,Jo Morgan,Danielle Bartram,Ed Southall,Dawn Denyer,Emma BellRobert Smith and Hannah Radcliffe. It was fun doing some of the excellent puzzles created by Ed (and put on his website solvemymaths.com) and meeting other teachers on twitter including 

Session 2

For session 2 I attended the talk by the excellent Johnny Ball – I’m pleased to say that I managed to have my photo taken with him and get a copy of oe of his books signed. He talked about lots of interesting things, including the propertie of elliptical billiard tables (as marketed by Paul Newman apparently), Archimede’s discovery of the formula for the volume of a cone, why eclipses happen and the fact that Robert Hooke invented sash windows. One particularly simple thing that he pointed out was the fact that if you draw a chord from a point \((-b,b^2)\) on the left hand side of \(y = x^2 \) to a point \((a,a^2)\) on the right hand side of \( y = x^2 \) then this chord intersects the \(y-\) axis at the value \(ab\). The proof of this, is of course a simple application of a method to find the equation of a straight line

Feel free to play with this yourself on a short GeoGebra sheet I have hosted here. I can’t believe I had never spotted this before. He also showed a beautifully simple demonstration of parabolic motion, I tweeted a video of this, but will try to upload it to this blog soon too.

Session 3

For the final session of the day I went to Jo Morgan‘s session on “Tips and Tricks”. This session was fantastic, and despite following her resourceaholic blog avidly there were plenty of things I hadn’t considered before. 

The organisation of the session was great, with some questions to do and then time to discuss with other people. It was great meeting Keith Morrison and talking about different approaches with him. 

I’d never seen the indian method for calculating HCF and LCM. 

I’m not really sure how I feel about it – think I may give it a go with one of my classes and see what they think. 

It was interesting to see different methods for finding the minimum of a quadratic curve – I always default to completing the square, but lots of GCSE students seem to find completing the square hard so maybe this is not the best approach. The symmetry method, I think is something I use if I have a graph in front of me, but I hadn’t considered using it purely algebraically before.  

Jo also talked about the great “Nix the Tricks” book that is avaialable freely online. I’m a big fan of this book, but I definitely won’t be using this approach when teaching the simplification of surds. I realy don’t see the advantage of this.

Jo has made her presentation and workbook (I was strangely excited to get a workbook!) available online here and she will be blogging more about the content of her presentation soon.

Invetween

Inbetween all of this I had some useful comversations in the exhibitors area, especially with Tim Stirrup (@timstirrup) of Mathspace. I think Mathspace is a great product, and the fact that they are adding in more A-Level content makes it an even more attractive proposition. I also bought a few books from the MA stand and nicely discounted prices, discussed the Core Maths qualification with @AQAMaths and had an interesting discussion with the maths team at Oxford University Press (@OxfordEdMaths) about their textbooks for the new curriculum. 

All in all a great day!!

Categories
Uncategorized

A Little Bit of Pi

As it is the \( \pi \) day of the century I thought I really should write a short blog post about it. 

Most people know that the first digits of pi are \( \pi = 3.141592653 \), and this year using the american format for representing the date we can get the first 9 decimal places on 3/14/15 at 9:26:53 in the morning. As I will be at #mathsconf2015 then I am going to post this post a bit early, and release it on Thursday, as most schools will celebrate pi day on the Friday before.

Since I was at school I have been pretty interested in the computation of pi, I think that this was sparked by my Year 7 maths teacher giving me a book called “The Joy of Pi” by David Blatner when he left the school. 

In March 2014 David Bailey and Jonathan Borwein (famous amongst pi afficionados) wrote an article for The Mathematical Association of America about Pi Day which is well worth a read and Kate Bush even wrote a song about pi! Admittedly she gets some of the decimal digits that she sings worng….

Calculating Pi

People have been trying to calculate pi for thousands of years, the babylonians used the approximation \( \pi \approx 3.125 \) and there is evidence from the Rhind Papyrus that the Egyptian scribe Ahmes took \( \pi \) to be the ratio 256/81, or approximately 3.16049 – this is less than 1% off the true value. Pi also seems to come up in the design of the Great Pyramid at Giza; the ratio of the length of one side to the height is approximately \( \pi / 2 \). 

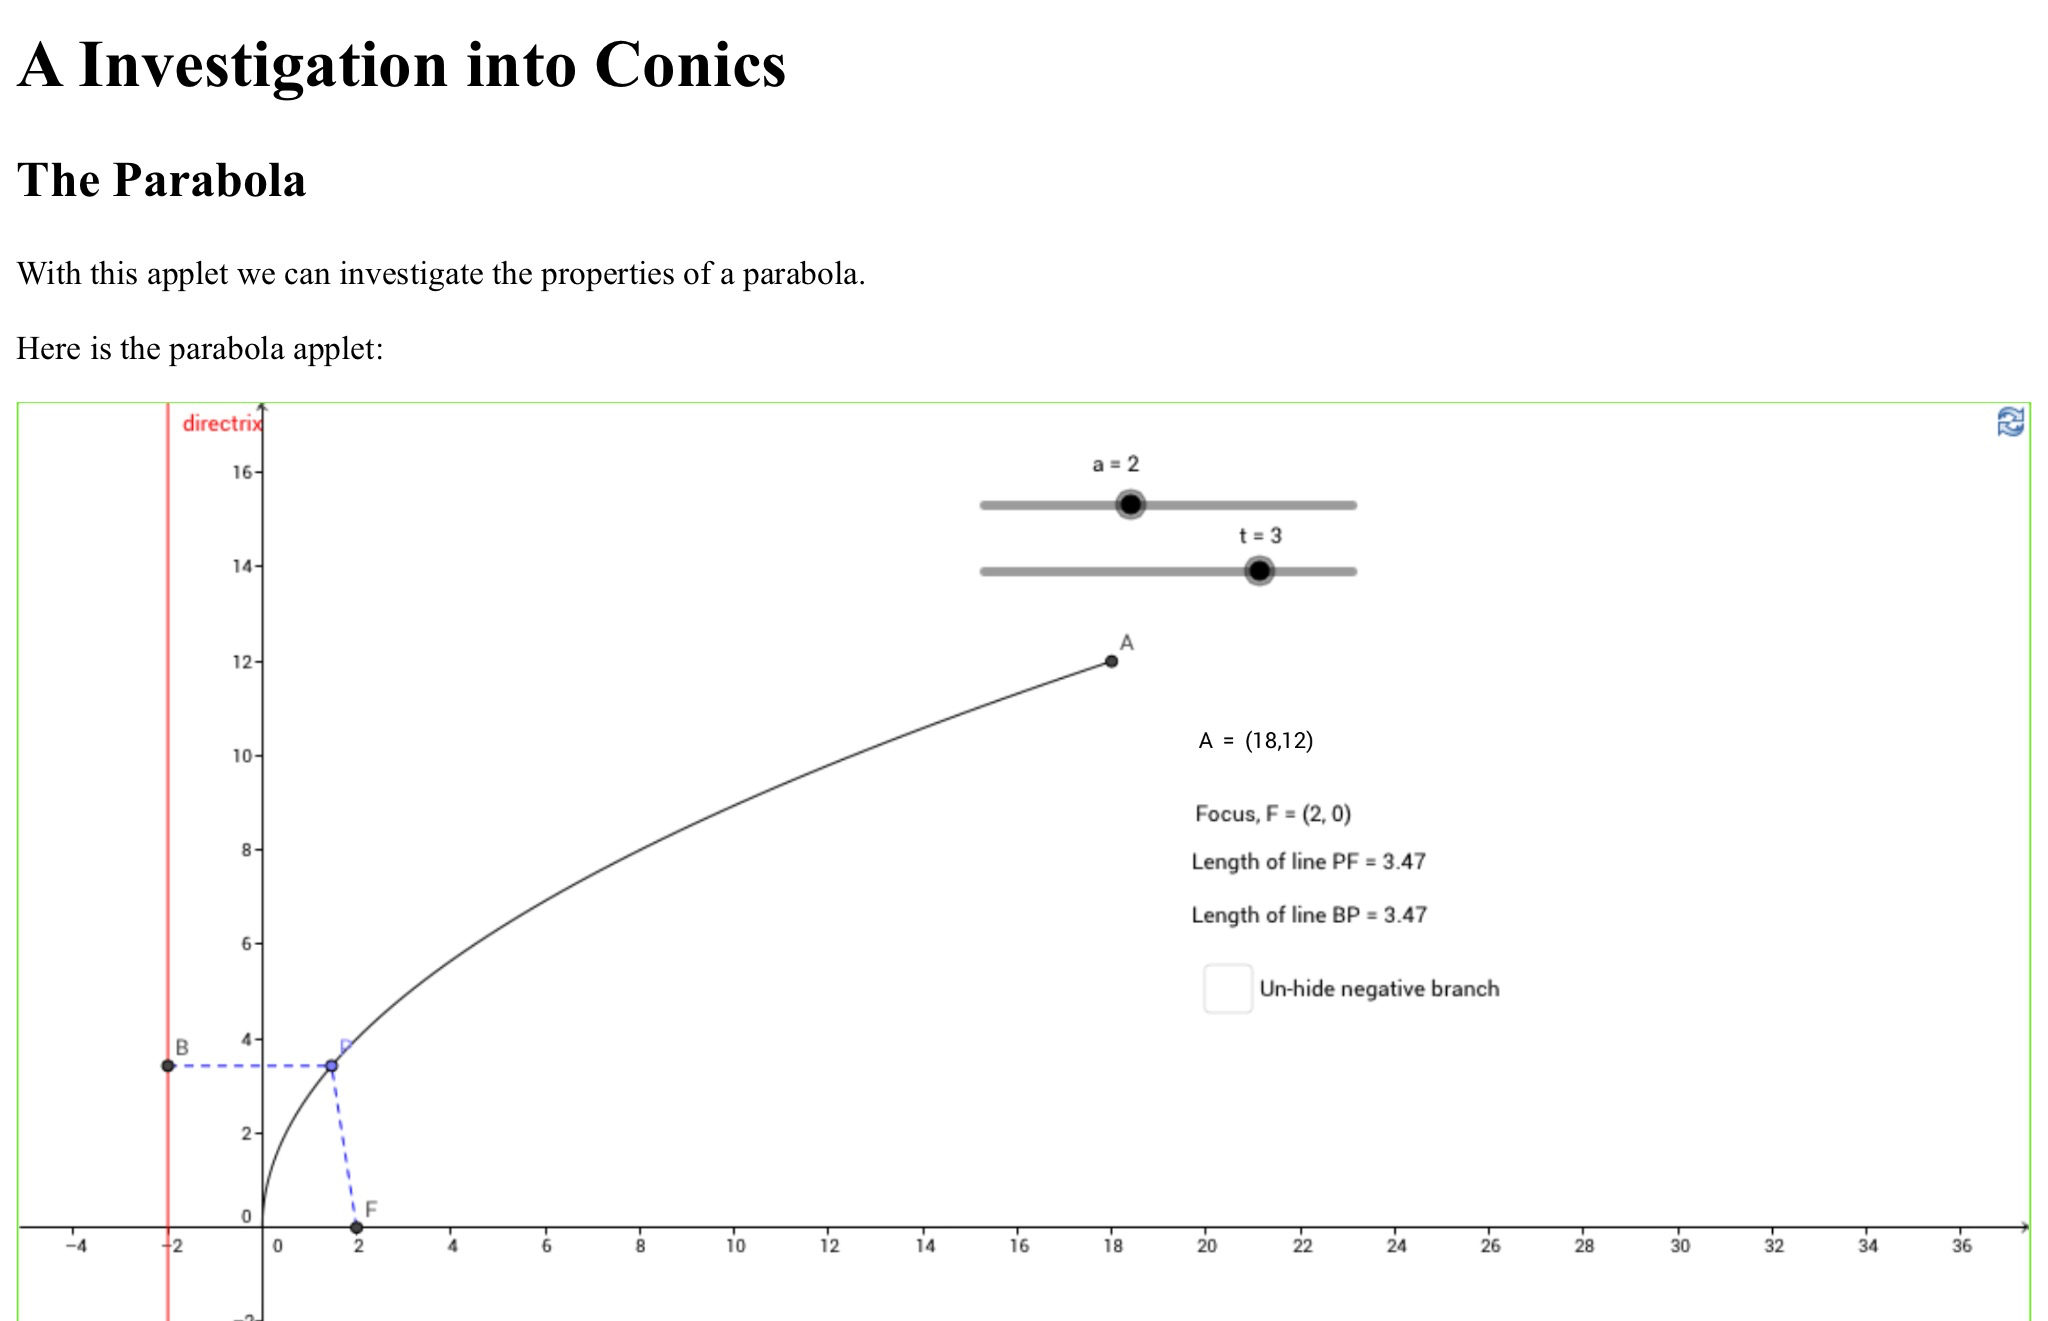
The ancient greeks seem to have been the first to try and pin down a value of pi by a systematic means. Antiphon and Bryson of Heraclea (around 469-399 BC) used the method of exhaustion to approximate pi. They deduced that if you take a regular polygon, such as a hexagon, and keep doubling the number of sides then the limiting shape is a circle. Antiphon inscribed successive polygons inside a circle and calculated their areas, Bryson then circumscribed polygons around the cicle and compared the areas of the inscribed and circumscribed polygons. This gave an upper and a lower bound on the value of \( \pi \) since the area of a circle with radius 1 is \( \pi \). Archimedes did something similar, but instead found the circumference of inscribed and circumscribed polygons – he bounded pi between the following \( 3\frac{1}{7} < \pi < 3\frac{10}{71} \). An interactive applet of Antiphon’s and Bryson’s construction can be found here where you will see an embedded geogebra app like the following 

As you can see, working out the area of a 512 sided polygon only results in upper and lower bounds that agree to 3 decimal places.  Clearly people needed to find a better method….

Since the ancient greeks many people have tried to improve the number of accurate decimal digits of pi that are known, but until an improvement in the calculation algorithms happened, the number of known decimal places didn’t improve dramatically. Today, the current record was announced on 8th October 2014, where 13,300,000,000,000 decimal places were computed and verified. THe increase in the number of decimal places oer the last 600 years or so can be seen in the plot below (data taken from Wikipedia’s chronology of computation of pi page)

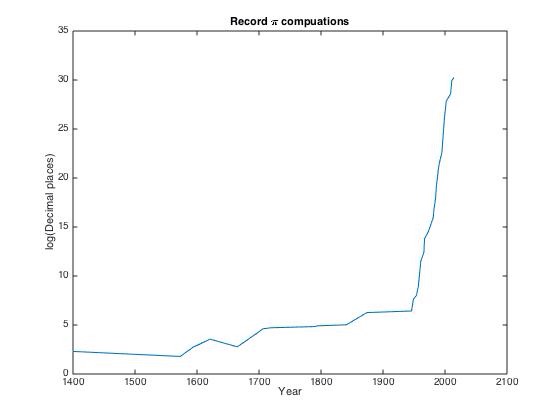
Disclaimer: This is a plot generated quickly, I’m aware that it should be a step function style plot!!

In 1621, the Dutch mathematician Willebrod Snell improved on the polygon method, and derived a better way to approximate the perimeter of a circle using a polygon of fewer sides – he was able to find pi correct to 6 decimal places using a 96 sided polygon. Things really took off though when people moved away from using polygons to calculate pi and embraced calculus. Many power series representations were discovered and employed to increase the number of decimal digits. Maybe I will write about these for pi day next year!! The Aperiodical have produced a video showing a few slowly converging methods to approximate \( \pi \)

I want to briefly examine a more modern method discovered independently by Eugene Salamin and Richard Brent in 1975, known as the Brent-Salamin algorithm. This algorithm works by computing the arithmetic-geometric mean of two specific numbers. The arithmetic mean of two numbers \(a\) and \(b\)  is what people generally know as the mean, namely \(\frac{a+b}{2}\), whereas the geometric mean can be computed as \(\sqrt{ab}\). As an aside, for non-negative real numbers the arithmetic mean is always greater than or equal to the geometric mean – this is a fact we may use in some future posts discussing the analysis of finite element methods. Anyway, back to the arithmetic geometric mean algorithm: The arithmetic geometric mean or \(agm(a,b)\) is computed by repeatedly taking arithmetic and geometric means. You start with \(a_0 = a \) and \(b_0 = b \) then you keep computing the iterates 

\( \begin{align*} a_{n+1} &= \frac{a_n+b_n}{2} \\ b_{n+1} &= \sqrt{a_nb_n} \end{align*} \)

until your values for \(a_n\) and \(b_n\) agree to some accuracy. For example the first few iterations of the computation of the arithmetic-geometric mean of 12 and 17 produce the following

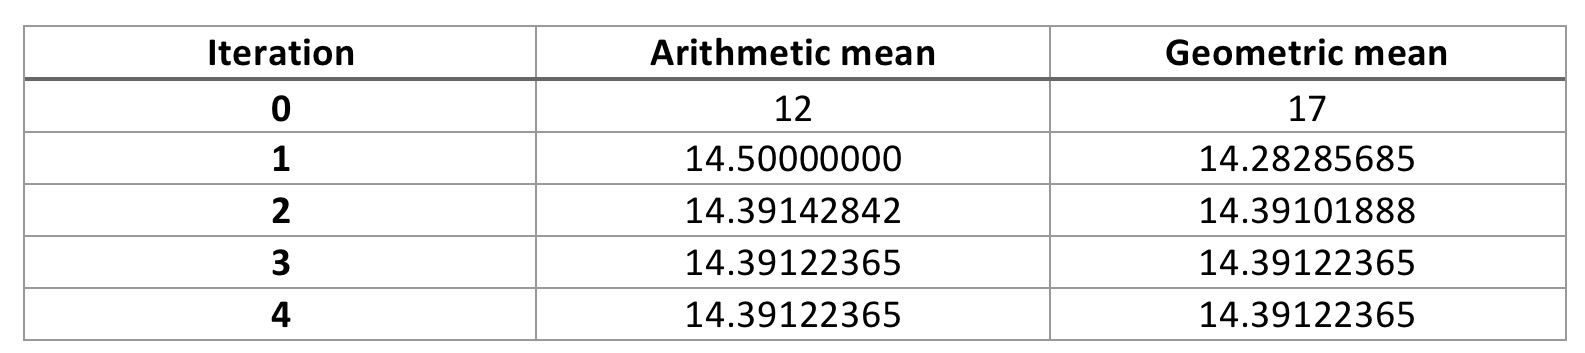
The (very simple) Matlab code to generate these numbers is here. As you can see, after only 3 iterations we have agreement to 8 decimal places, this very fast convergence (technically it is quadratic) is the reason why the agm algorithm for computing pi is so popular. 

To compute \(\pi \) we set \(a = 1 \) and \( b = \frac{1}{\sqrt{2}} \), compute \( agm(a,b) \) but as we do so, in addition to computing \(a_n\) and \(b_n\) we compute \( c_n  = a_{n+1} – a_n \). At the end we can then compute

\( S = \frac{1}{4} – \sum_{n=0}^{N} 2^n c_n^2, \)

where \(N \) is the number of iterations we have used to compute the arithmetic-geometric mean. Finally, we can compute \( \pi \) with the following 

\( \pi = \frac{(agm(a,b))^2}{S} \)

In 2011 Cleve Moler, the creator of Matlab wrote a great blog post on using Matlab’s variable precision arithmetic to generate digits of pi. In this he presented an implementation of the agm algorithm, which I have modified very slighty and used to compute some digits of \( \pi \) on my laptop. The code is available here and I ran it on a mid 2013 Macbook Air with a 1.3GHz Core i5 processor with 8GB of 1600 MHz DDR3 RAM. The table below shows the number of iterations and time taken to compute a certain number of decimal digits.


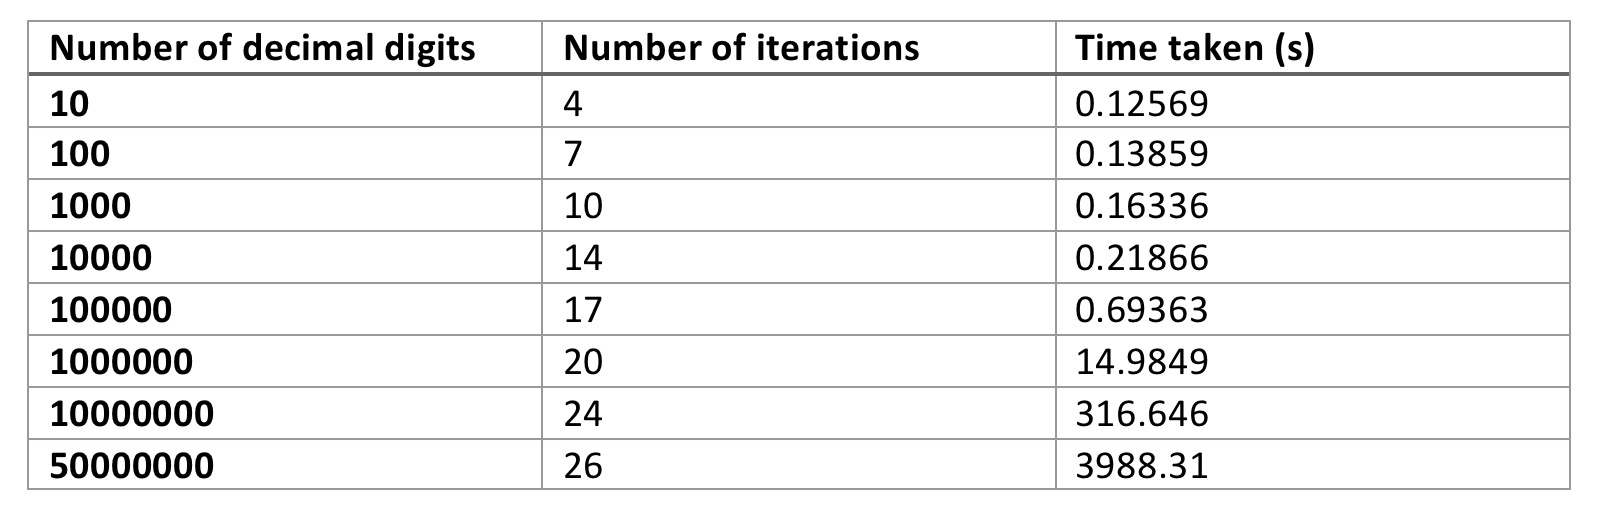
As can be seen from the table, the time taken rapidly starts to increase even though the number of iterations is growing fairly slowly. Implementing this in Matlab is obviously not the most efficient way, it would be far better (but harder) to implement it in C++ or Fortran using a robust variable precision arithmetic library. Variable precision arithmetic in itself is costly in terms of memory and computation time. As a non-scientific comparison Moler reported that computing 100000 digits took about 2.5 seconds on his laptop of the time.

The original papers of Brent and Salamin are fairly dense reads and include some elliptic integral theory which really isn’t my area. Luckily, a 1984 SIAM Review paper by Borwein and Borwein where they derive a similar iteration based on the arithmetic-geometric mean is much more accessible and is available at this link. The algorithm for computing \( \pi \) is contained in section 5; they also present algorithms for the calculation of other elementary functions.

I’m sure I will return to the problem of computing \( \pi \) on this blog in the future. Happy Pi Day!

Categories
Uncategorized

Math(s) Teachers at Play 83

Earlier this week I was honoured to hear that Stephen Cavadino (@srcav) had featured my post on conics with GeoGebra in Issue 83 of the Math(s) Teachers at Play blog carnival. 

The Teachers at Play blog carnival was started by Denise Gaskins (@letsplaymath) who regularly blogs herself. I can’t believe I didn’t know about the existence of this carnival until this week! There some great posts in this issue, and I have spent a lot of time this weekend reading through some posts from previous editions. 

Please do check out this issue here.

Thanks again for including me. 

Categories
Teaching

Pentominoes

Since starting teaching I’ve noticed that a lot of teachers like to use pentominoes for various activities.
As a way of learning and practicing some Javascript and getting to know the Fabric.js (@fabricjs) canvas library I have produced a pentomino arranging exercise, a screen shot is shown below:

(null)

You can move and rotate the pieces with a mouse (to rotate use the rotation handle that appears when you click on a piece), it should also work on touch devices.

Feel free to have a go here if you aWnt. The objective is simple – rearrange the pentominoes to tile the rectangle on the left hand side of the screen.

Categories
Uncategorized

Mathematician or Educator?

A couple of weeks ago I was at an IMA organised Mathematics and Industry event at Rolls-Royce in Derby. One of the speakers posed the question “Are you a mathematician or educator?”. This has led me to think about where I stand on the related  “Mathematician or educator?” question.

Ultimately I would describe myself as a mathematician who teaches. Whilst I’m passionate about good teaching and teaching concepts in a way that everyone can understand I don’t feel that teaching defines my outlook on life. Whereas being a mathematician in some way seems to define how my brain works and how I look at the world. 

I think it is easy to forget the mathematician in the day-to-day world of teaching but I think I owe it to my students to let them see the mathematician side of me and not just the teacher side of me. 

I’m really interested to see what other maths teachers think, particularly those who didn’t do a maths degree. Please leave a comment or message on Twitter 🙂 

Categories
A Level Software Teaching

Geogebra and Further Maths

This week I had an observed lesson, where the remit was that I do something risky that I perhaps wouldn’t have done otherwise.

My Year 12 Further Maths class had been selected as my observation lesson – I found thinknig of something risky to do with them harder than if it had been any other group. They are used to me doing odd things, that are a bit off the wall with them and they always respond well. In the end I decided to use ICT and try to get them to do some independent discovery work.

We have just started the coordinate geometry section of FP1 (Edexcel) and wer due to look at the parabola this week. I have used GeoGebra a bit in the past but I had never created my own geogebra worksheet before and this seemed like the perfect opportunity.

So, one evening I installed the latest version of GeoGebra on my MacBook, signed up for a GeoGebra Tube account and set about creating a worksheet where students would be able to explore the parametric equations of a parabola and the focus directrix property for themselves. I then uploaded the file to GeoGebra Tube, and got the content ID from the embed option. As I didn’t want to rely on GeoGebra being installed / working on all the computers in my teaching room I decided to upload a html version to my own webpage. The GeoGebra tean have made this really easy by poviding a javascript library that you can just source at the top of your html code and then a really simple API to embed a dynamic worksheet in your webpage. They have provided examples of how to do this.The web apps for the Parabola and Hyperbola that I created are here. On loading the page you should see a screen that looks like this:

I then wrote a sheet with some questions to guide the students’ explorations here, these questions should prompt them to derive the parametric equations of the parabola and notice the focus-directrix property. It is significantly harder to answer the questions concerning the hyperbola – I saw these as hard extension questions.

All of my class seemed to enjoy using these and engaged well with the work. Walking round the room I also saw some great responses to questions. 

To produce the worksheets, upload to GeoGebra Tube and then host on my website took in total about 2 hours which I don’t think is bad for a first time. 

My intention is to use GeoGebra moe across the keystages, any worksheets I create I will share through my website as well as GeoGebra Tube. The original GeoGebra files (in case you want to modify them) are here (parabola) and here (hyperbola). I will also be adding a worksheet for the Ellipse to the webpage later too. 

Some examples of students responses to the questions are shown below:


Update: Please be aware that for the web applets to load there has to be communication with the GeoGebra website, so make sure that is not on your schools block list.