Categories
Uncategorized

GCSE Revision

Tomorrow I am hosting the NCETM’s #mathscpdchat on the topic of GCSE revision.

Screenshot 2016-04-25 20.25.09

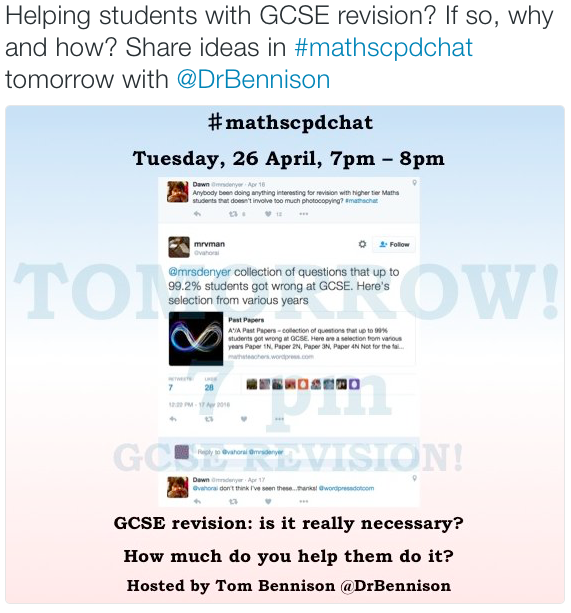
I thought that I would briefly post tonight with a few thoughts and possible ideas for the discussion tomorrow.

For me, in an ideal world GCSE revision wouldn’t be necessary as if there is true understanding I don’t believe that you should have to coach towards a particular exam, as long as the content has been covered. I also think that it tends to be the time of year where (needs must) we aim to get marks, possibly at the expense of understanding, wheeling out things like formula triangles, “keep change flip” etc to get marks for the precious grades that go towards performance measures. I always try to steer clear of these and of “teaching to the test”, but with the current GCSEs it is easy to create questions for students to practise that are very similar to exam questions see my recent post “Edexcel November 2015 GCSE Paper” .

Some things that I would be interested to discuss tomorrow:

  • How do you teach students to revise mathematics?
  • Do you feel that GCSE revision dilutes the purity of the subject?
  • What are the best ways you can get your students to revise?
  • Do you do anything exciting / different in revision lessons?
  • How does GCSE revision tie in with intervention?

Looking forward to discussing it all tomorrow 😉

Categories
Uncategorized

Twitter Revision Questions

For the last three weeks I have been writing GCSE Foundation, GCSE Higher, AS-Level (Core 1 and Core 2) and A-Level questions to be tweeted out by my school’s mathematics department in an effort to encourage students to do at least some maths revision every day. These are all designed with the current Edexcel specifications in mind, but I’m sure would be useful for other exam boards.

I thought I would post the first three weeks of these here in case the questions were of use to anyone.

Feel free to use as you wish.

Categories
Uncategorized

Bar charts and the Arithmetic Mean

I’ve just enjoyed reading Anne Watson’s latest blog post “Finding Nemo and Dissection” on the Oxford Education blog and at the end of it was something that I haven’t noticed before.

If you represent discrete data as a bar chart, then the arithmetic mean of that data is a number such that if you draw a line at that value on the \(y-\)axis then the area of the bars above the line is the same of the area of the gaps below the line.

For example, consider the data set \(\{6,4,7,2,8,3\}\) which has arithmetic mean \(5\). As you can see from the diagram below the areas above and the gaps below the line (plotted at the arithmetic mean of the data) are equal.

Screenshot 2016-04-19 22.07.24

Categories
Uncategorized

A #mathsjournalclub Announcement

You may have seen that I was a bit stupid and we missed the date of the next #mathsjournalclub because I put the incorrect date in my calendar. 

We were due to discuss the article “Reasoning Reasonably in Mathematics” by John Mason et al on the 11th April, which due to my mistake was moved to the 16th April. However, John Mason has said that he cannot make that date as he will be in Oklahoma, so I am proposing that we postpone it to a date that John can make. I believe, that where possible, having one of the article’s authors taking part in the discussion can improve the discussion significantly, so I hope no one is too frustrated at the repeated re-scheduling. I will let everyone know when I have a suitable date; I have been looking forward to discussing this one as I have tried one of the tasks with a few classes.

However, I would like to have a #mathsjournalclub discussion soon, and given the coming changes to A-Level mathematics  I think looking at the recent paper by Ian Jones, Chris Wheadon, Sara Humphries and Matthew Inglis entitled “50 Years of A-Level Mathematics: Have Standards Changed” would be useful. I am proposing that we discuss this on Monday 9th May at the usual time of 8pm. As the article is pay-walled we will be looking at a pre-print version available Here.

As a bit of a taster, here is a graph from the paper….  


Categories
Uncategorized

Posing Mathematical Questions

Sometimes I find it interesting to think about what kind of maths I could develop out of a given picture. I’m curious to see the kinds of things other people come up with. 

What kind of mathematical questions could you pose using the following four pictures as stimuli: 


Categories
Uncategorized

Manipulating Constants of Integration

I was recently asked about the integration of \( \frac{1}{3x} \), this had come up in the solution of a differential equation. More specifically the fact that there are multiple ways to integrate this: 

 At first glance these do not appear to be the same, however plotting them suggests that they are part of the same family of solution curves.logs

Indeed a simple manipulation of the constant of integration shows them to be the same functions apart from the addition of a constant.  

 Of course these constants would be fixed by an initial condition, and so both versions of the integration would lead to the same solution of the differential equation.

I have a vague memory of having this confusion myself when I was an A-Level student, but since then I haven’t really thought about this as I always “pull any constants outside of the integral” before integrating.

Thinking about this a bit more, I think that a great question for students would be to ask them to explain why \( [(1/3)\ln (x)]_1^3 = [(1/3)\ln (3x)]_1^3 \). I’m sure many would just evaluate the integrals as shown below, but asking for an explanation could lead to a deep discussion about the nature of the logarithm function. 


Categories
Uncategorized

Edexcel November 2015 GCSE Paper

My Year 11 students have recently sat the Edexcel November 2015 papers as mocks and it was (as ever) interesting to mark these papers and see where they succeeded and where they fell down.

For feedback I have written some questions that are similar to a few questions from these papers, such as the one shown below:Screenshot 2016-04-01 23.31.12

Incase they are useful to anyone the questions corresponding to Paper 1 are here, along with corresponding solutions. The solutions are very rough and ready – please forgive me.

Categories
Uncategorized

Graphics Changes in MATLAB

I am a bit late to the party here and despite having fairly recently updated to MATLAB R2016a I have only just noticed that graphics have changed in MATLAB (apparently this happened in release R2014b)!

Among other things the default colour order when plotting multiple functions has changed as has the colormap used in surf. But more excitingly it is now easier to modify things such as axis properties.

For example to produce the graph shown below (and featured in my previous post)singraph

You only need the following few lines of code

Screenshot 2016-04-01 23.10.59

Of course it always has been relatively easy to produce plots in MATLAB, the big change is that once I have access to the graphics object i can now use ‘dot’ notation to set properties, much like you would with a structure, or in a general object-oriented programming language. This looks so much cleaner than using the old style set syntaxScreenshot 2016-04-01 23.16.13

You can also now easily rotate the tick labels, for example you can modify the above plot to Screenshot 2016-04-01 23.16.47

using the following simple command

Screenshot 2016-04-01 23.18.48

I like these modifications and this has reminded me that I really should stay more up to date with the improvements that each new MATLAB release brings.