As I’m sure some of you know I love going out for food and am happy to spend ages reading menus as I walk down a street.
Ever since I was a child I have enjoyed looking at the price of things on menus, working out various things.
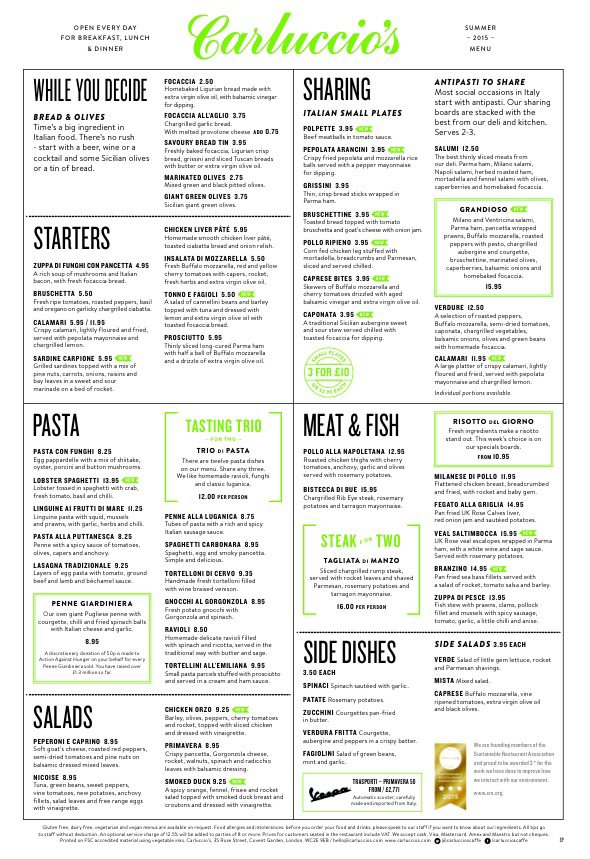 For example on the above menu (from Carluccio’s, which is one of my favourite Italian restaurants) you could work out the most expensive and the cheapest three course combination. You could also compare it to the set menu and work out the most you could save – it’s always good to maximise savings! There’s also a multitude of the “I’ve bought 4 main courses, 3 desserts and 2 starters and it costs this much, what did I buy type?” problems. In a similar vein I have used menu prices when creating simultaneous equations that are harder than the typical GCSE integer valued questions. By creating some margin percentages for each meal, and some numbers representing the number of covers of each sold in a night a matrix multiplication problem can be created to find the profit made by a restaurant from one service. This could also lead on to discussions about the conditions necessary for the matrix multiplication ABc to be the same as the matrix multiplication BAc (where c is a cold vector containing the meal prices)…
I’d recently been led to think about menu pricing when a picture was posted on Twitter. It reminded me of a study that I had read a couple of years ago on the effect of price formatting on the sales in a restaurant. This study “Effects of Menu-price Formats on Restaurant Checks” by Yang, S, Kimes, S and Sessarego was published in the Cornell Hospitality Report in 2009. In this study diners were given menus with three different price formats and the effect of these formats on the total bills paid. As you would expect the party size had the most impact, dining duration and guests willingness to pay also had a large effect (the p value was less than 0.0001 for these three variables). The overall regression analysis combined the three different price formats into one variable, which didn’t seem to affect the total price paid significantly. However, the authors then performed a more detailed analysis of the three different price formats using a linear contrast analysis and they found that parties with a numeral only format (i.e. no $ sign) spent $3.70 more than the average party and those who had been given the menus with the prices written in text spent $1.85 less. This increase translated to a 8.15 percent increase in spend per person. Perhaps this explains why more menus such as the Carluccio’s one above don’t include a £ sign when they list prices.
Colin Wright (@ColinTheMathmo) recently posted a picture of a menu similar to the one below
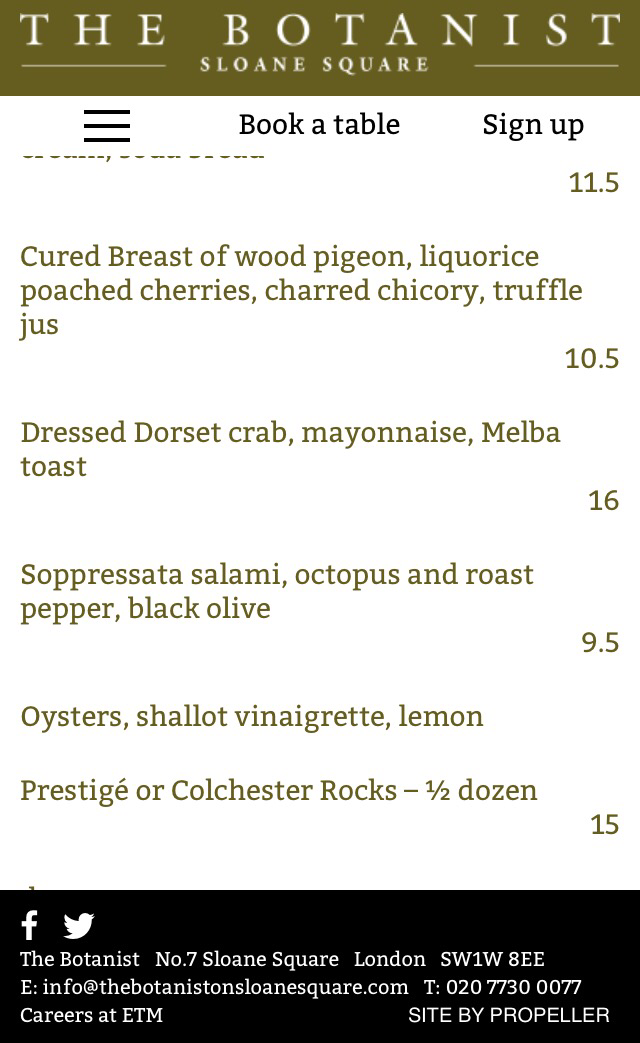 I’m not sure how I feel about the use of 9.5 instead of 9.50… Though any discomfort I have with it is, I guess, only because we are used to having prices with two decimal points. Realistically there is no reason to have the trailing zeros. What do you think?