As part of the Edexcel S2 course students study the Poisson distribution (which I have written about in two posts here and here before) and also it’s application as an approximation to the Binomial distribution.
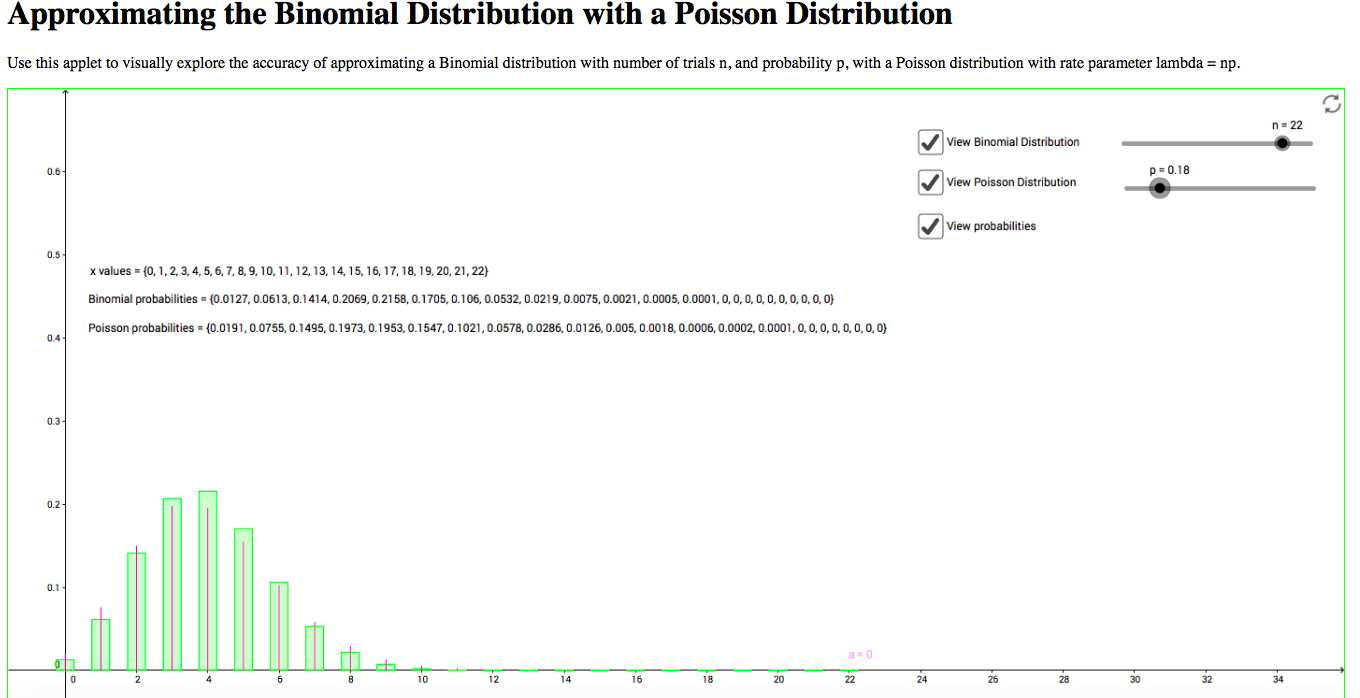
I find that people, most definitely including myself, don’t have an intuitive understanding of how good this approximation is and so I have made a small GeoGebra applet that allows you to explore this for varying values of \(n\) and \(p\). I have embedded it in a webpage on my website and there is a screen shot below.
I’ve found this applet also useful for just exploring the shape of the distributions as you can get a real “feel” for the effect of the probability parameter \(p\).
If you would like to, you can also download the original GeoGebra file.