Categories
Uncategorized

Engaging With Academia

If you follow me on Twitter then you probably know that I am pretty passionate about engaging with academia, both in terms of bringing current mathematical research into the classroom (if possible) and by engaging with the mathematical education community.

I feel pretty lucky in that I am based near Nottingham with the University of Nottingham on my doorstep. Not only has it got a beautiful campus and a great maths department but is also the home of The Centre for Research in Mathematics Education (CRME) convened by Malcolm Swan

Among others, Jeremy Hodgen (@JeremyHodgen), Colin Foster (@colinfoster77), Peter Gates @petergates3), Geoff Wake (@geoffwake1), Diane Dalby, Andy Noyes and Mark Simmons (@simmo1363) are all based at the CRME.

They hold an excellent series of seminars during term time, which I try to go to – I think I went to most of them this year – and are well worth the time.

If you have something similar near to you I would recommend that you get involved, and if you are near the CRME come to some of the seminars next year.

Categories
summerblogchallenge Uncategorized

A MathsJam Puzzle

This week was MathsJam week, and I really liked the puzzle that @KathrynHTaylor shared with us. I’ve reproduced it below: Can you do it and have you got an answer?

  • There are 50 seats on an aeroplane, and 50 people with numbered (in ascending order) tickets queing to board the plane. The first passenger doesn’t bother checking their seat number and sits randomly in a seat. The subsequent passengers sit in their allocated seated if it is free. If it has been taken, they then choose somewhere to sit (from the remaining free seats) at random. This process continues until all pasengers are seated. What is the probability that passenger 50 can sit in seat 50?
Categories
Uncategorized

For the Love of Books

Back in May, there seemed to be a craze of posting “shelfies” of our book collections; as mine are spread out over numerous shelves I collated all of mine into a blog post.

Unfortunately I can’t remember who started this (if it was you please come forward!) but many of us on Twitter shared photos of books and briefly mentioned some of your favourite ones. I said about how it would be good to have a central list of books that have either been recommended or reviewed by us on Twitter, maybe listing some of the things that were good about the books.

After this, Stuart Price (@sxpmaths) set off and created website where we could submit books and links to reviews etc to do exactly this. I couldn’t really believe how quickly he got this website up and running.

IMG_0645.PNG

Unfortunately until now, I haven’t gotten around to submitting any reviews or mentions, but this academic year I plan to change this. I am aiming to give myself some reading time every day (even if it is just 15 minutes) so that I can start to work through my large backlog of books, post reviews on my blog and then send to Stuart to update his site.

I’d really like to encourage other people to submit books and reviews to Stuart too, I think it could become a valuable reference if collaboratively we build it up so that it is fairly comprehensive.

Categories
Uncategorized

Parental Anxiety with Mathematics

It is well known that for some people mathematics causes great anxiety and an article from the Telegraph by Javier Espinoza (@JaviereTMG) last Tuesday (11th August) reported on research linking parental maths anxiety to lower attainment in mathematics by their children. Have a read…

Aside from the fairly awful headline (ability and attainment are not necessarily the same), like many reporting of educational research there was

  • No link to the original research paper
  • Claims made that are not well explained.

The above things really do irritate me – how hard is it to include a link to a research paper? Luckily the paper is actually pretty easy to find online through the webpage of Professor Sian Beilock, one of the authors of the study who is quoted in the Telegraph article. In fact you may recognise the name as she is the author of the fairly popular book “Choke: What the Secrets of the Brain Reveals About Getting it Right When you Have To”. The paper is available at this link on her research lab’s homepage and was published in Psychological Science OnlineFirst, an official journal of the Association of Psychological Science.

Overall I feel this is a very interesting piece of research, and their methods are explained very well. The study looks at a group of 438 children (from 90 separate classes) across 29 different schools in the Midwest states of the US. These children were selected from a larger group of 868, from whom children were removed for various reasons, including the need for parental data for each child. As the authors admit, the children whose parents chose to participate came from higher socio-economic status (SES) schools than those that did not – unfortunately this seems common with this kind of study. Despite this the students were still drawn from schools where the percentage of children receiving free or reduced price lunches (a common proxy for socio-economic status, though we all know this is not without its faults) ranged from 0% to 97%.

Teacher’s math anxiety and knowledge were also assessed, and due to missing data from the teachers the number of children who could be used reduced to 379 (211 girls, 168 boys) across 27 different schools with 76 teachers (73 female and 3 male).

The children completed measures of achievement – both in reading and mathematics, and in math anxiety at the beginning and end of an academic year. Parents completed a questionnaire designed to grade their math anxiety and find out how often they help their children with their homework. Teacher’s maths knowledge and anxiety was assessed at the middle of the year (why not at the end?..)

In their paper they provide more detail than was given in the article. It seems that parental anxiety had an impact on children’s attainment when the parents were frequently helping with homework (this didn’t carry over to reading attainment). They then hypothesised that this decreased performance throughout the year would also lead to increased maths anxiety in the children. To do this they generated 5000 (better than some, but they could easily have done more) bootstrap samples to test the strength of the indirect path from “parents’ math anxiety through childrens end-of-year math achievement to children’s end-of-year math anxiety at three levels of parents’ homework-helping behaviour”. This showed that when parents frequently helped their children with their math homework, parents’ maths anxiety was related to their children’ end of year math anxiety, though as far as I can tell this has not been established in a causal way.  They also showed that the effect of parental anxiety on children’s attainment (when frequent homework help is given) was still present even when controlling for the maths knowledge of the parent.

Does anyone know of any similar studies in the UK?

I think this is a valuable piece of research as, to me, it highlights the need to engage with parents and try to reduce their maths anxiety as well as the students. Of course, students experience differing levels of help with homework, but where homework is given it is clear that it is given with good intentions. If it is the case that simple statement by parents can negate the positive effect of help, then I am sure many parents would like to know how to tackle this. I think further study is needed to confirm some of these results and explore in detail how parental help could differ as a function of math anxiety, but it certainly can’t do any harm to engage parents more with this.

As an aside I’m very interested in these Woodcock-Johnson tests that were used – does anyone have a copy?

Categories
Uncategorized

One Week Till #mathsjournalclub

So, this holiday seems to be going pretty quick, and it we are now only a week away from the first #mathsjournalclub discussion! Next Monday (24th August 2015) at 8pm we are going to be discussing “A Glimpse into Secondary Students’ Understanding of Functions” by Brendefur, J, Hughes, G and Ely, R. The paper is here if you haven’t had a chance to read it yet.

I sat down to read it at the weekend with a bacon sandwich and found it an interesting read.  

  We shall start the discussion with a general “What did you think of the article?” and see where it leads us, but here are a few things you may like to think about:

  • What did you think were the key points of the article?
  • Do you agree with the four ways given that “students typically represent functional relationships: graphs, tables, verbal descriptions and equations” ?
  • Has this article impacted on how you introduce and teach the understanding of functions?
  • What are the limitations of the article/research?

One of the referenced papers is also worth a read as it is referred to extensively when the authors discuss covariational reasoning. This is the paper “Applying covariational reasoning while modelling dynamic events: A framework and a study” by Carlson, Jacobs, Coe, Larsen and Hsu.

I’m looking forward to hearing everyone’s thoughts next week. Also, please send any articles to me if you want them on the Poll for the next article selection….

Categories
Uncategorized

Whitstable Maths

I sometimes like to show photos in a lesson and ask either specific maths questions prompted by the photo or a general “What maths can you see?” These are pretty good when what I had planned finishes a bit too early – especially if I can tie the photos into the maths we have been studying. 

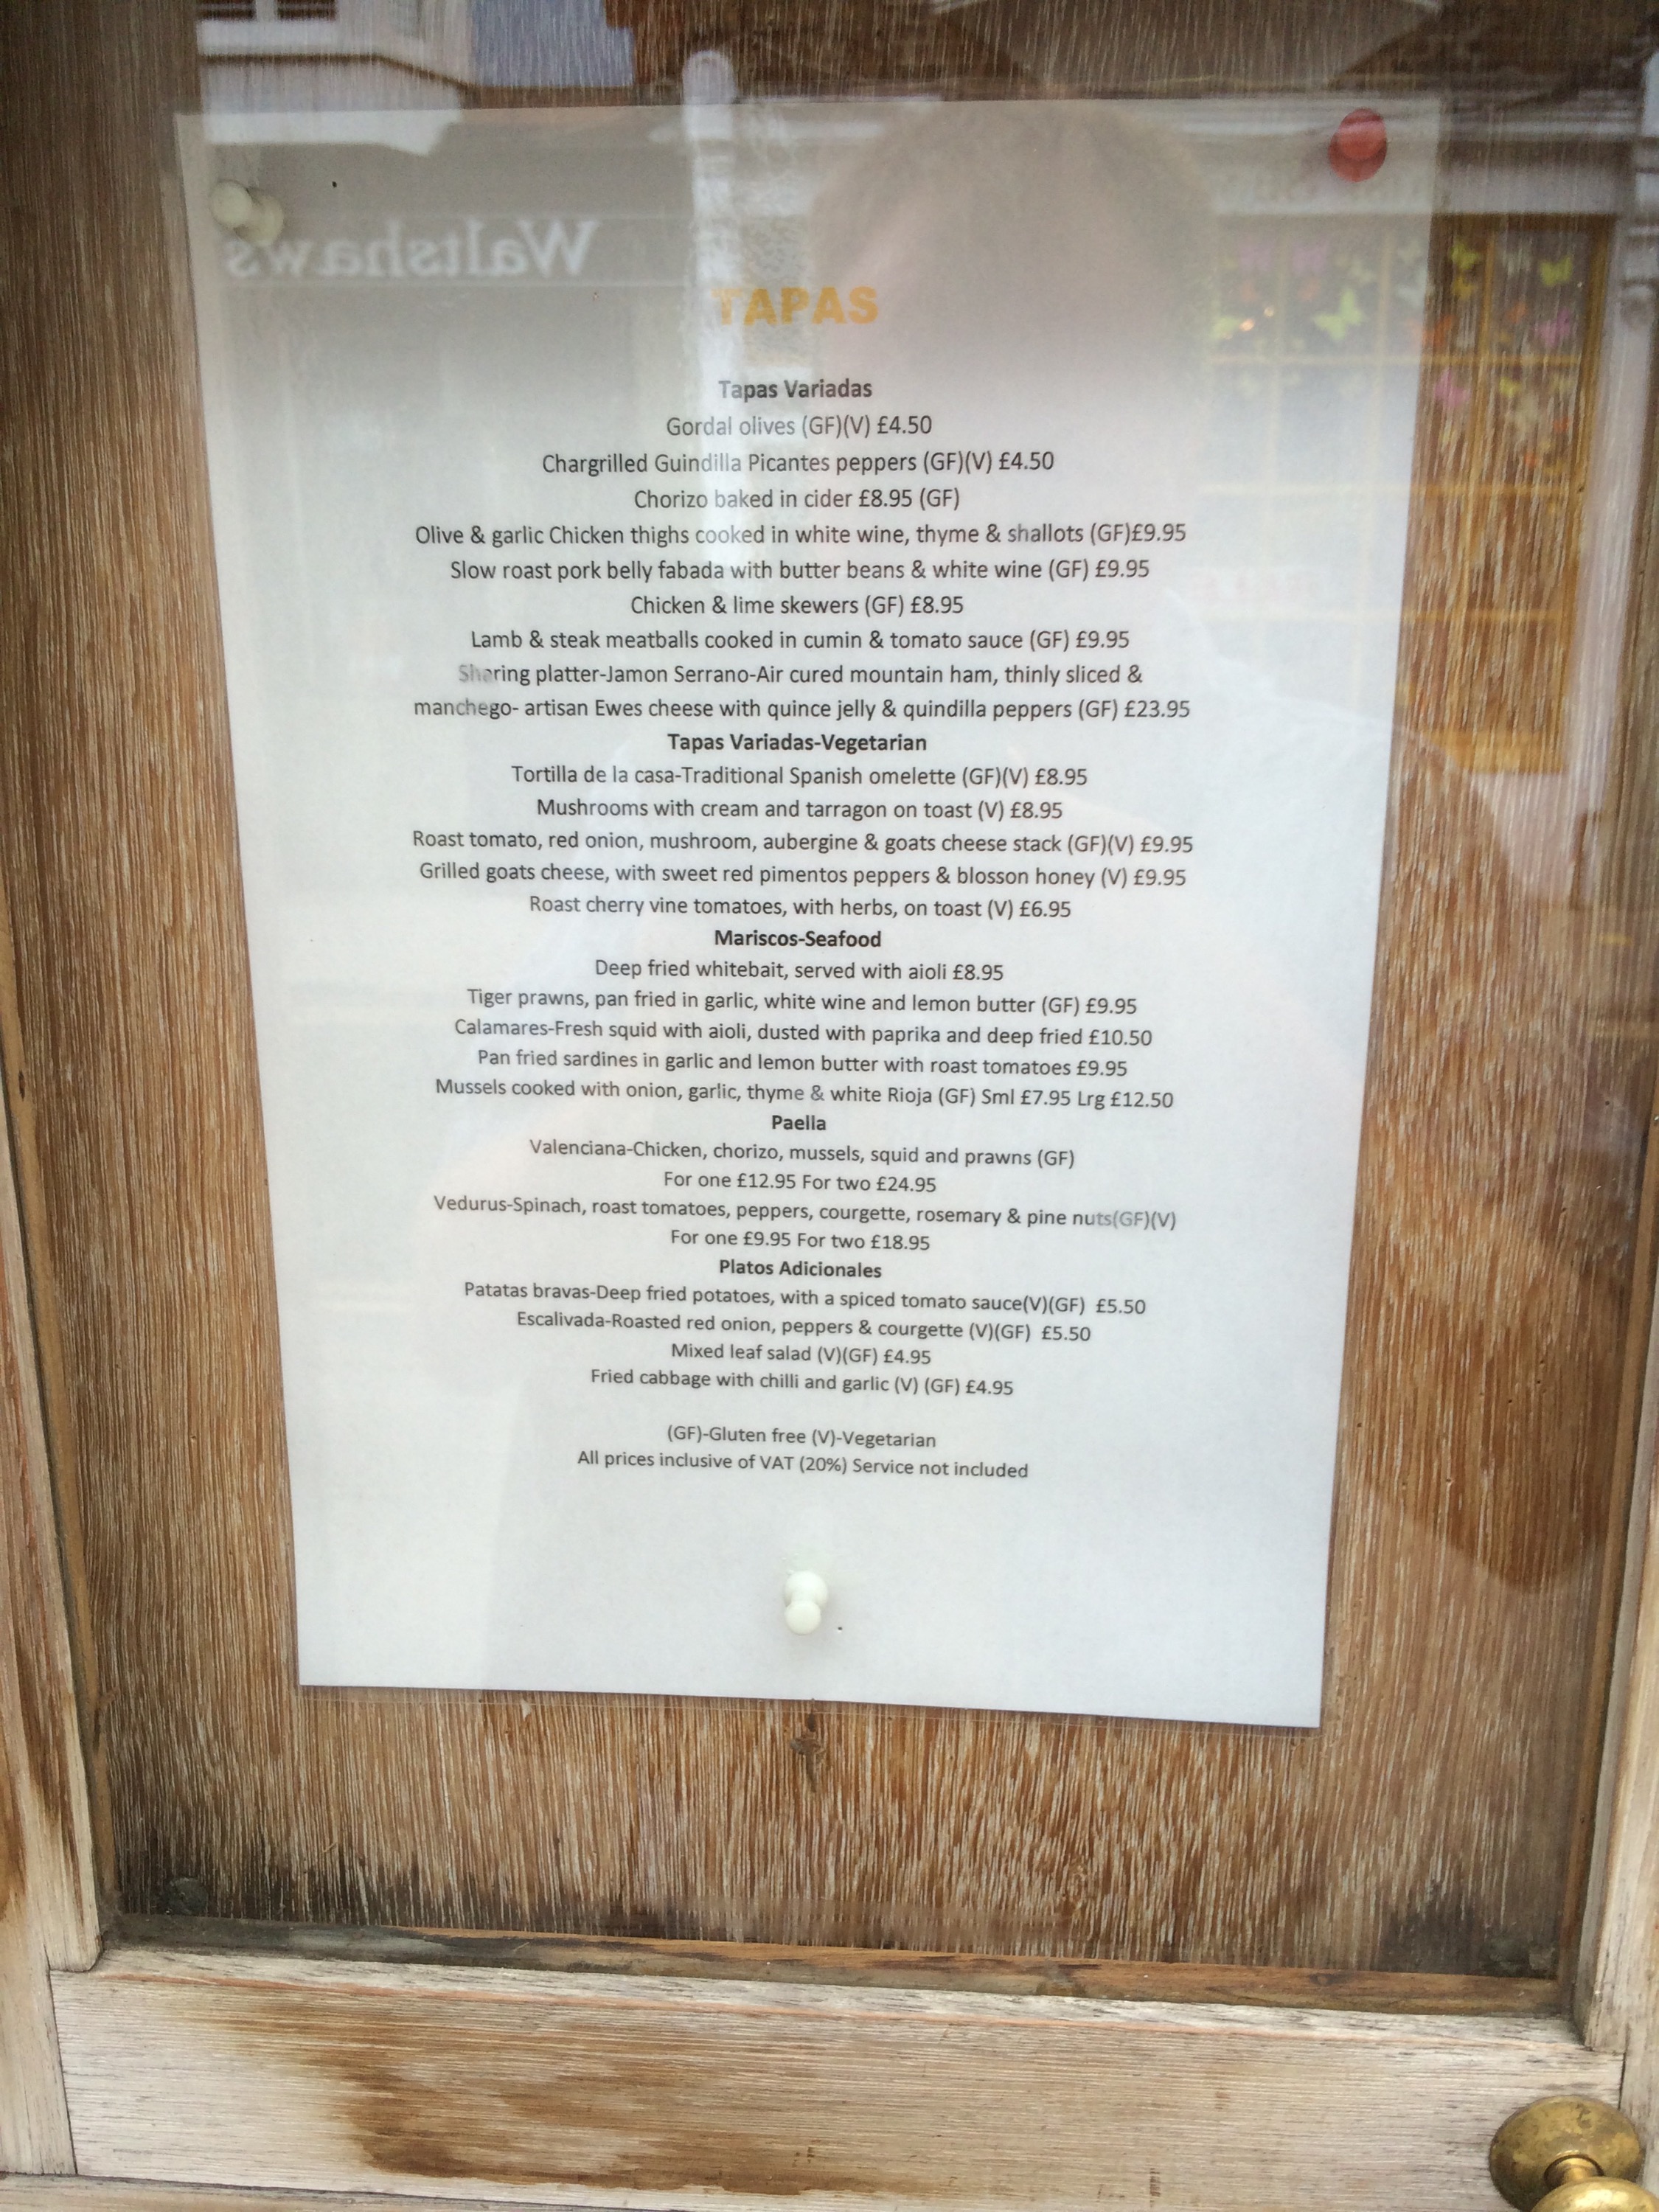
Yesterday I was in Whitstable, Kent and took the following couple of photos (among a few others):


  • What is the cheapest combination of picking 1 from each section of the menu? 
  • How many different combinations of dishes will achieve this cheapest price?
  • What about the most expensive combination?
  • What do you think the restaurant makes the most money on?

  
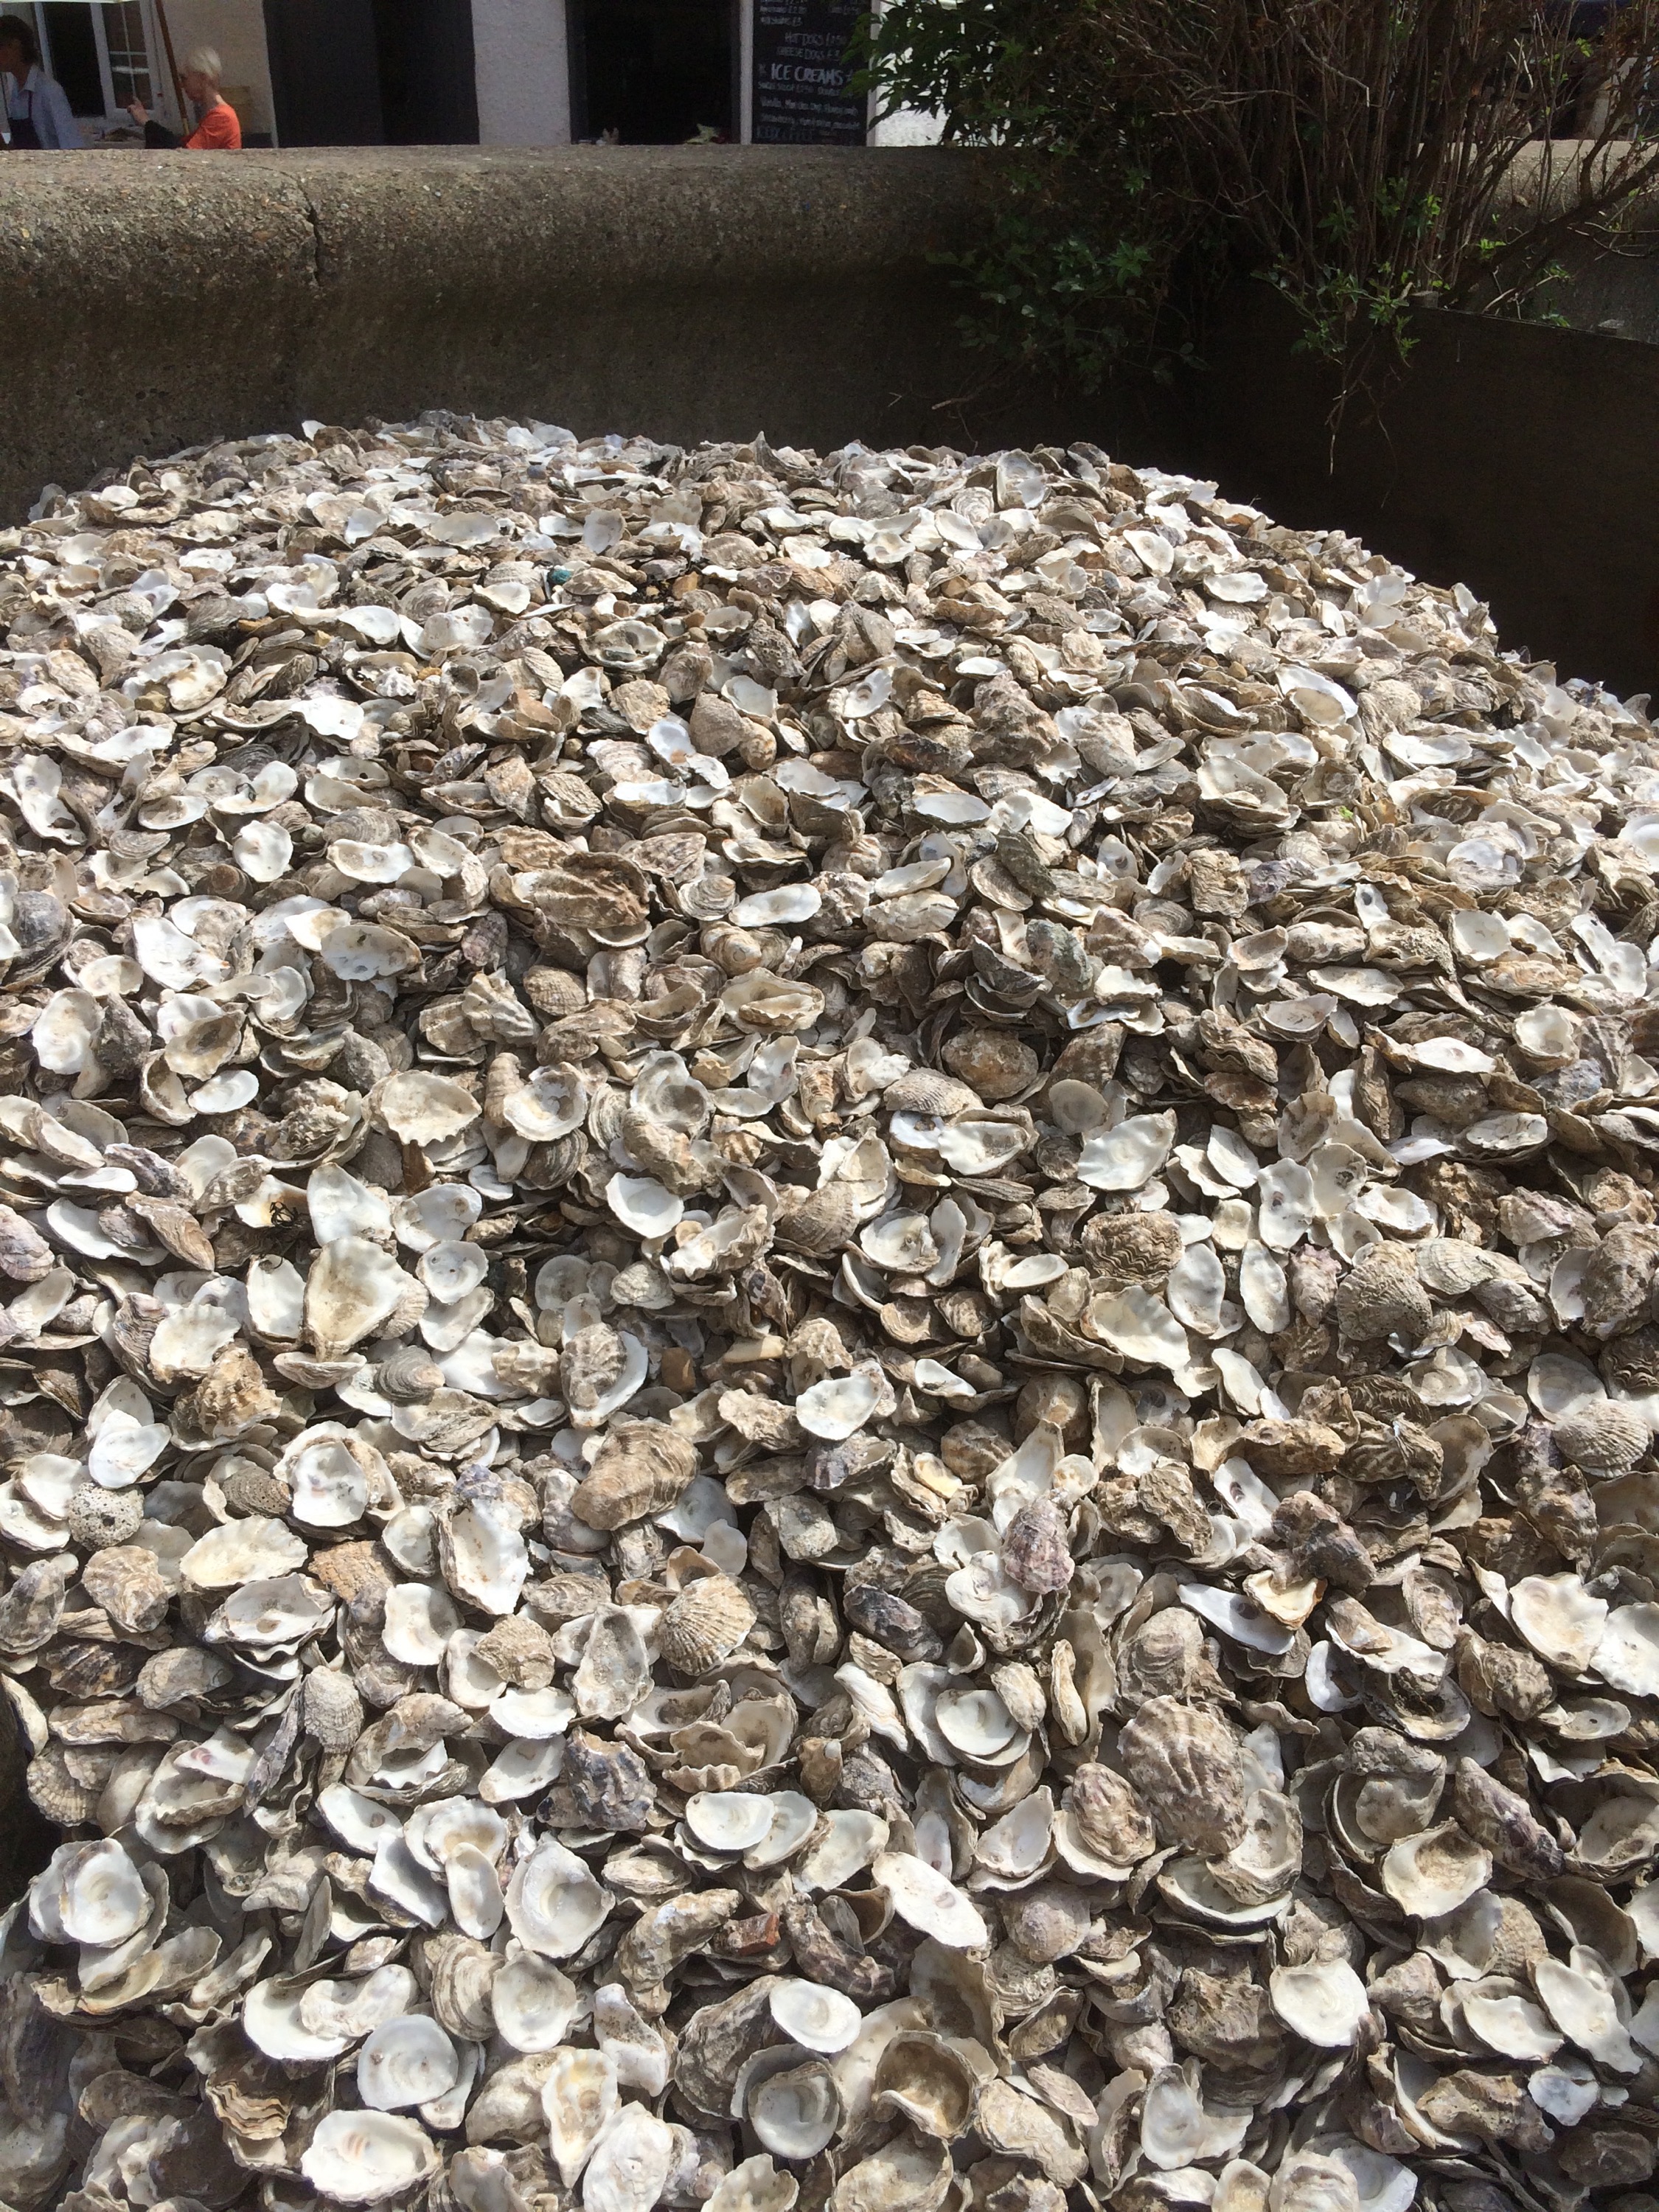
The above picture shows a pile of empty oyster shells from an oyster shack. The man in the top left corner of the picture is standing behind the wall and gives a sense of scale. This photo could lead into some good discussions on estimation (and the problems with estimation) such as:

  • How many oysters have been de-shelled to create the pile? 
  • What assumptions have you used?
  • If each oyster costs £2 how much money has been spent on Oysters to create this pile?
  • If the shack sells 500 oysters a day, how long did it take for the pile of shells to become this big?

Whilst I’m wary of spending too long on this type of activity all the time, I do find them both fun activities and activities that lead to lots of valuable mathematics. As a bonus, they seem to engage pupils pretty well too. 

Categories
Uncategorized

Very Short Introductions – Book Review 1

I love the “Very Short Introductions” series by Oxford University Press as generally they are very well written and accessible to a general audience but not patronising. 

 Number 260 in this series, “Numbers” by Peter M. Higgins is no exception to this rule. The text flows nicely, and (considering the brevity of the text) is a comprehensive introduction to the types of number – starting from the counting numbers, moving through rationals, reals and transcendentals before looking at different types of infinity and countable versus uncountable sets. The book ends with an introduction to complex numbers and operations on complex numbers.

Here are a few highlights from the book:

  • When discussing primes there is the following aid to memory given “inequality signs always point to the smaller quantity”. It may seem stupid, but I don’t think I have ever said that.
  • He often mentions things but doesn’t discuss them in full – this is really effective at encouraging people to go away and find out more – for example the Cattle Problem attributed to Archimedes.
  • There is a great exploration of Cantor’s Middle Third Set where there is a suggestion that using a ternary representation of numbers instead of decimal makes it easier to see that there are infinitely many numbers in the Middle Third Set. Recall that to construct the Middle Third Set you start with the unit interval \([0,1] \) and delete the middle third (i.e remove all the numbers between \(\frac{1}{3}\) and \(\frac{2}{3}\).) This  process is then repeated recursively on the remaining intervals. If you represent numbers in ternary then working in base 3 a third is given by 0.1 and 0.2 represents two thirds. So removing the first middle portion removes all the numbers whose ternary expansion starts with a 1, the next iteration removes all those numbers remaining which have a 1 in the second place in their ternary expansion and so on. So in the end, all numbers with a 1 anywhere in their ternary expansion have been removed. I really like this approach, as it makes it a lot clearer that Cantor’s Middle Third Set is uncountable. 
  • Introducing matrices by relating them to complex numbers is really nice. The number \(z = a+ i b \) can be represented by the matrix \( \begin{pmatrix} a & b \\ -b & a \end{pmatrix} \). If I do ever write an A-Level textbook I think I could be tempted to introduce matrices after complex numbers to make the link with matrix multiplication etc. 

I’d encourage anyone to get this book and they are also all £4.99 instead of £7.99 at the moment if you buy them through Blackwells. 

Categories
Uncategorized

The Damn Quotient Rule

Last night Kirsty and I had Tom (@tomJwicks) and his girlfriend Charlotte over for dinner. I’ve known Tom a long time – in fact since he did a summer project in the maths department at Nottingham when he was an undergraduate. He is almost at the end of his PhD and from September will be taking on the role of “Teaching Officer” in the maths department at the University of Nottingham. Part of his role will be supporting first year undergraduates in their transition to university maths, and another part will be providing enrichment type activities to local schools. In the past we have delivered many enrichment sessions together, some graduate school courses together (he took over the Introduction to Quantitative Methods and Quantitative Methods of Engineers course when I left) and various other sessions in schools before I became a teacher – it is fair to say that we have a similar style and agree on lots of things.

One of the things we have similar viewpoints on is the quotient rule that is taught at A-Level for differentiation, namely the following:

If \(f(x) = \frac{u(x)}{v(x)} \) then \( f'(x) = \frac{u'(x)v(x) – v'(x)u(x)}{(v(x))^2} \)

If you know me, you will know that I hate the fact that this is taught… Over the course of my A-Level I realised that I made far fewer mistakes if I just used the product rule on \(u(x)v^{-1}(x) \) directly – it seems that minus sign is pretty irritating for me! Also, I tend to find it easier to simplify expressions derived from an application of the product rule than those due to an application of the quotient rule. Personally I don’t know many people who do actually use the quotient rule anyway. My reason for not liking it being explicitly taught in the A-Level is that students often see it as another rule they need to learn, and don’t necessarily appreciate that it can just be derived from the product rule, they tend to make more sign errors too.

Tom had this to say on the quotient rule “Can’t be doing with it; Definitely should get rid of it. It has no value. In fact it’s worse than that in that it’s another thing for the students to remember and can cause a whole lot of confusion. he worst thing is when they get confused about where to put the minus sign, which clearly shows a gap in their understanding. It would just emerge if they use the product rule.”

What do you think of the product rule?


Categories
Uncategorized

A Picture of Tea

Earlier on today I took the picture below of my tea cup (Lipton Passionfruit and Raspberry black tea, brought back from Madeira if you are interested)


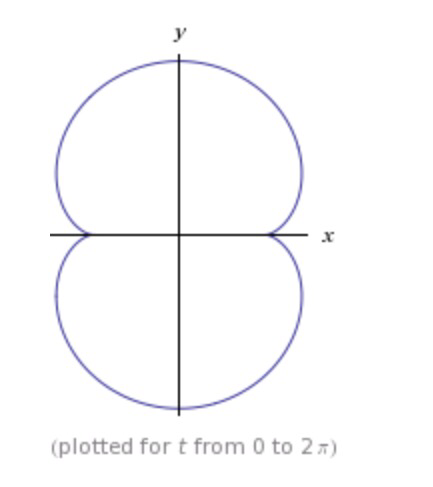
I’ve always liked seeing this pattern at the bottom of a tea cup and I’m sure many of you recognise it as an example of a caustic curve. This is the envelope  rays of light reflected on a curved surface. In fact, the curve shown above is half of a nephroid (the name is derived from the word for kidney shaped( as shown in this plot from Wolfram Alpha

Mathematically this curve is defined by the following equations

\( \begin{align} x(t) &= a(3\cos (t) – \cos (3t)) \\ y(t) &= a(3\sin (t) – \sin (3t)) \end{align} \)

with cartesian curve

\( (-4a^2 + x^2 + y^2)^3 = 108a^4y^2 \)

You may have plotted these curves in school as they are a popular “stitching pattern”. Namely, place \(n\) points equip-distributed around the circumference of a circle, and then work round the circle joining the \(n\)th point to the \(3n\)th point with straight lines. I’ll do one as an example at some point and post it on here.

In the mean time just marvel at the fact that such a cool curve appears at the bottom of a cup of tea! The light rays need to meet the cup at a very precise angle to obtain this curve – in fact tilting the cup gives some nice curves as they transition into and out of a nephroid.

Categories
Uncategorized

FMSP Favourite Problems – Number 3

After far too long an hiatus I am continuing with my discussion posts on the 6 problems that the Further Mathematics Support Programme, FMSP (@furthermaths) have selected for their “Favourite Problems” poster series.

Problem 3 is described on their poster shown below:

This is actually a pretty interesting problem, with a very low threshold for pupils to attempt – as long as they can generate a table of factors of a number they can make a start by adding numbers and connections. For example , we have the next 5 numbers:

  • 7 can be added without creating any links.
  • 8 needs to be connected to 2 and 4.
  • 9 needs to be connected to 3.
  • 10 needs to be connected to 2 and 5.
  • 11 can be added without creating any links.

Adding these numbers gives the following diagram: 

  If we consider the integers as the vertices of a graph, then this problem becomes that of finding the smallest number such that we cannot draw a planar graph where the vertices are connected in the way described above. A graph is planar if none of the edges cross each other.

Fairly quickly, you realise that the numbers that will be hard to add to the diagram are those with lots of factors, so my next step was to draw up a table looking at the number of factors (excluding 1 and itself) a number has

[table id=factors /]

Looking at this table 24 and 30 stand out as they have 6 factors, the most of the numbers in the table. So lets look at the smallest of the two, 24. 24 has the following 6 factors when you exclude 1 and 24: 2, 3, 4, 6, 8, 12.

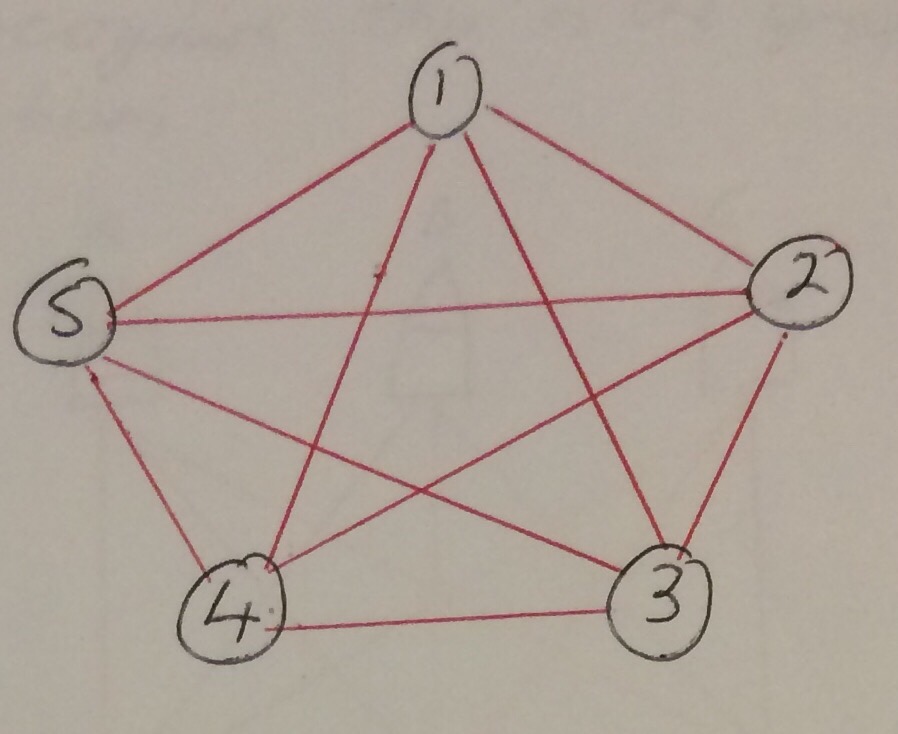
To show that it is not possible to draw the diagram for 24 we need to introduce the concept of a complete graph. A complete graph is one such that any pair of vertices of the graph is connected by a unique edge, or to put it another way, every vertex is joined to every other vertex by an edge. It is standard to denote the complete graph with \(n\) vertices as \(K_n\). Now it is known that \(K_4\)is planar and \(K_5\) is non-planar: To see this we can use the planarity testing algorithm studied at A-Level (see below) on \(K_5\) as shown below.  
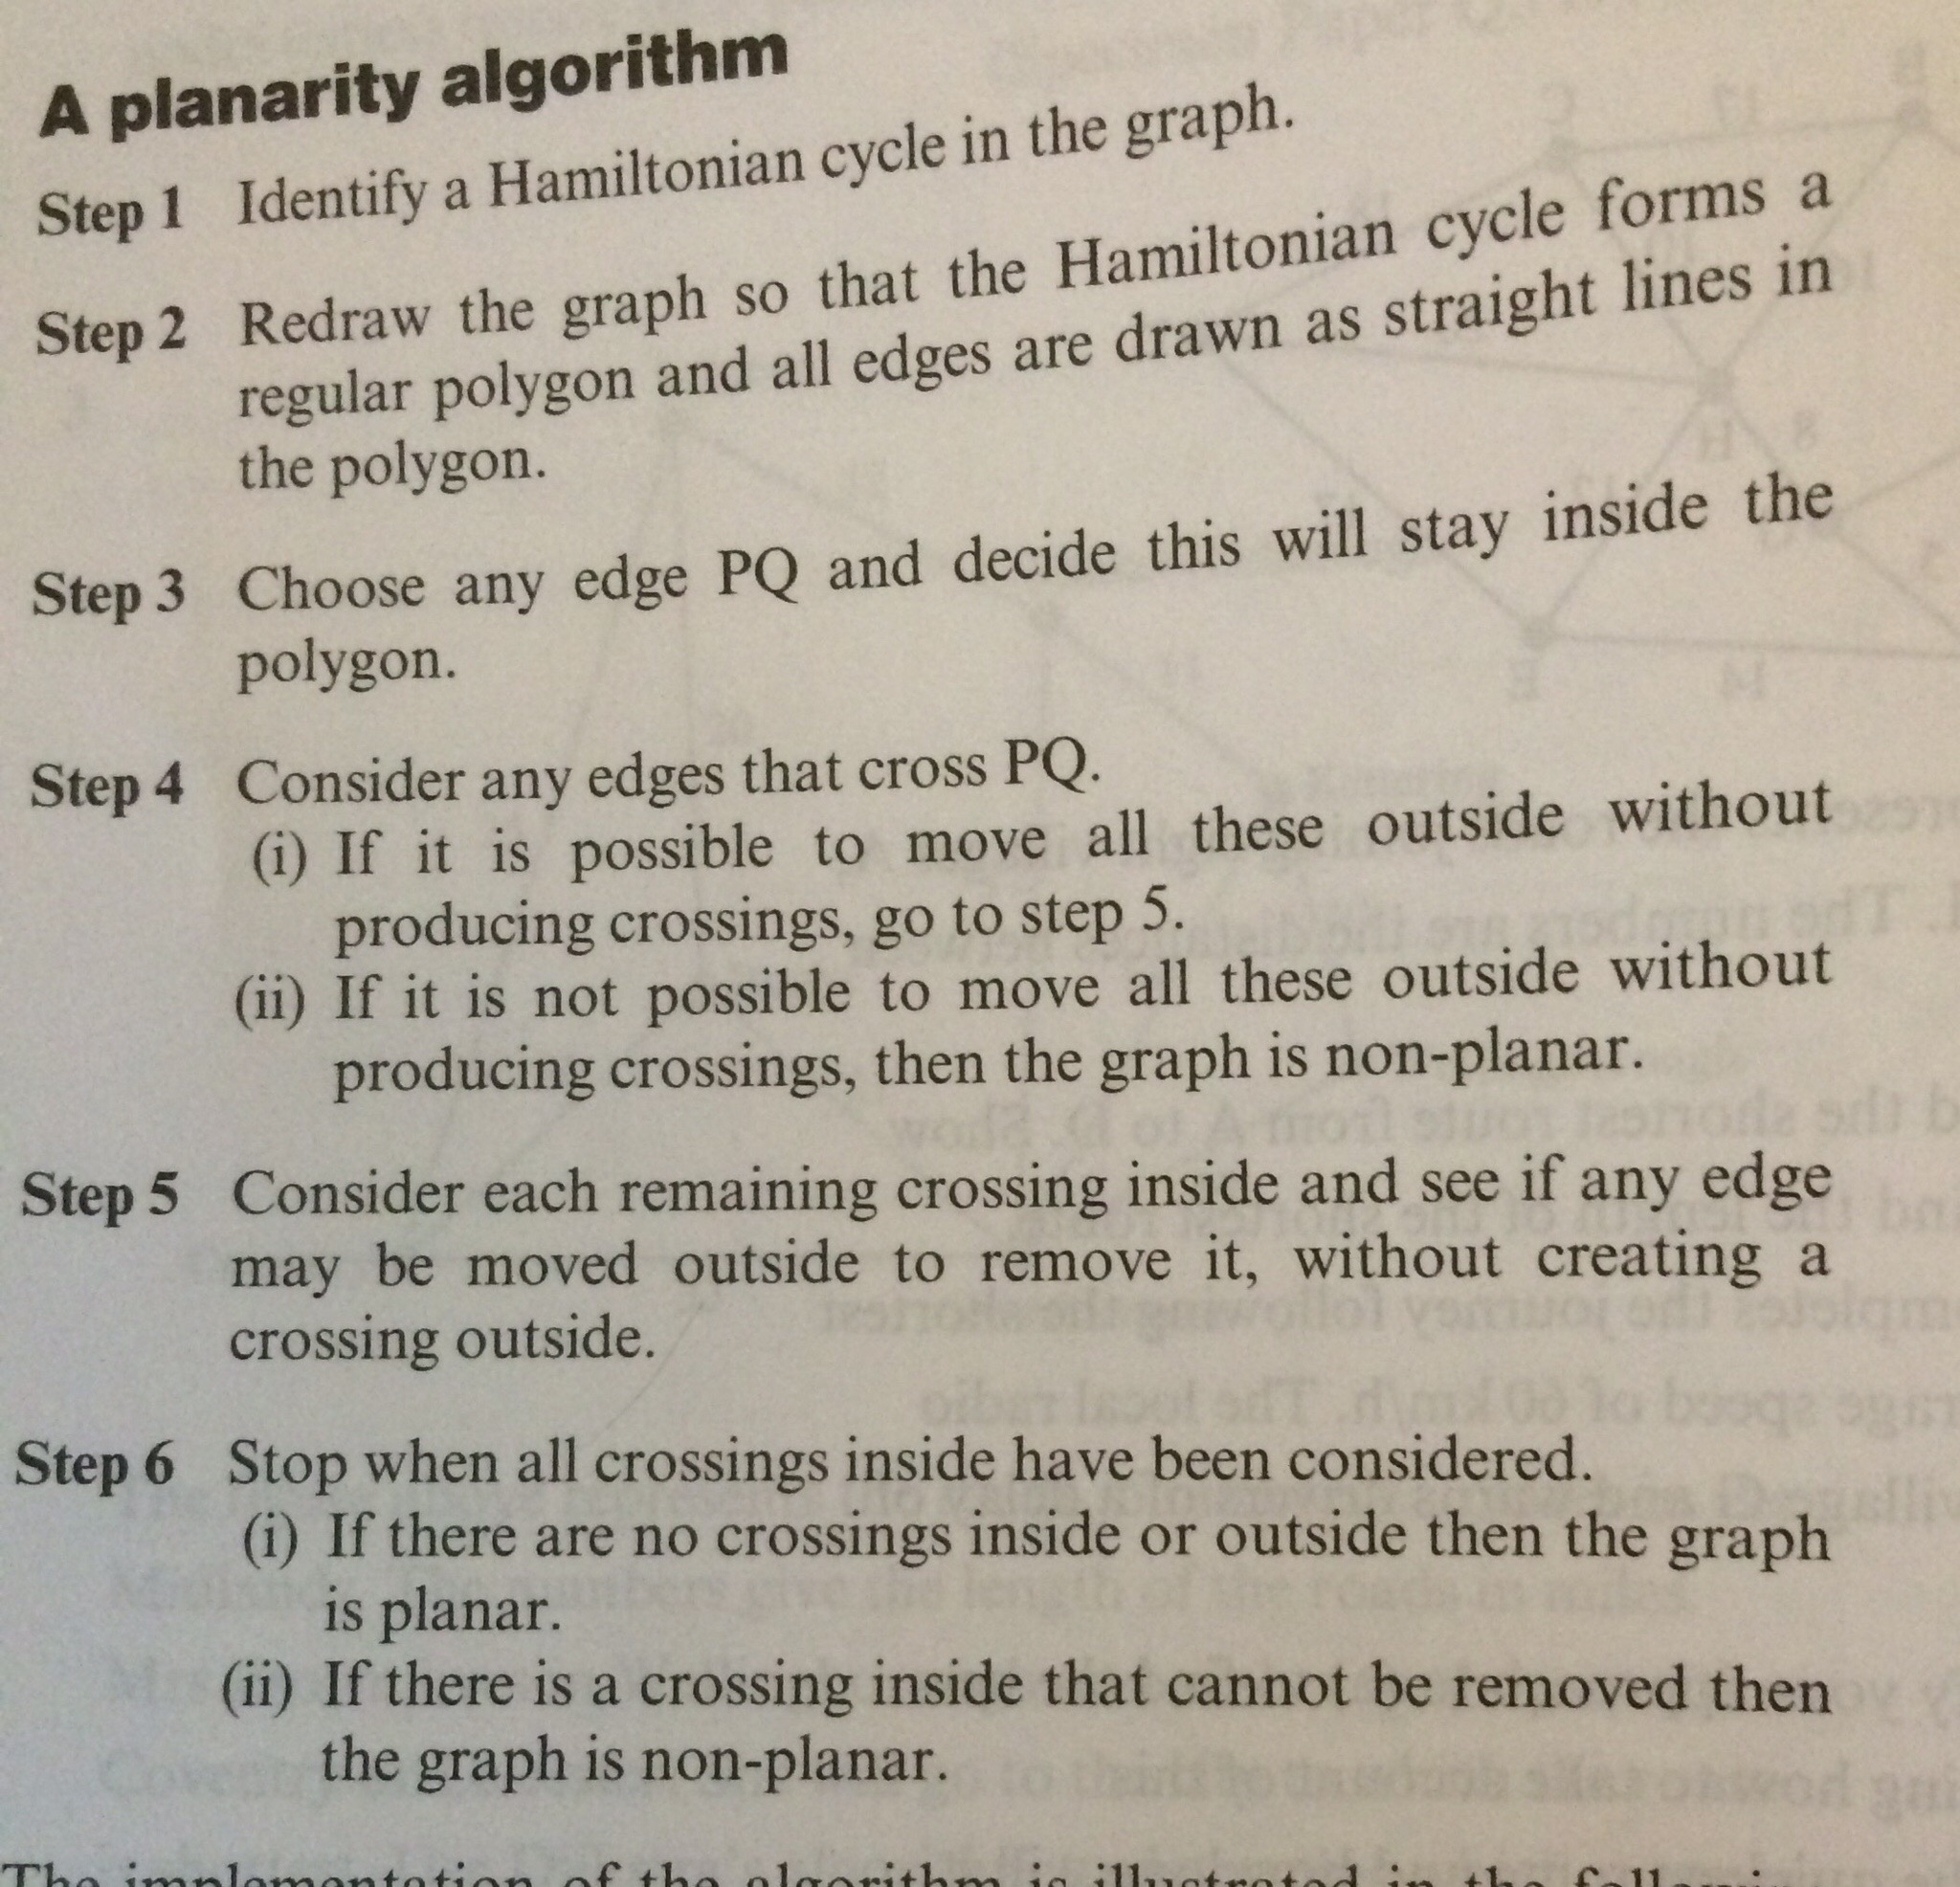
  1-2-3-4-5 form a Hamiltonian cycle, and we can then move edges 2-5 and 2-4 outside without introducing an edge crossing. However no other edges can be moved outside without introducing a crossing and so \(K_5\) is non-planar. 

 In fact whether any graph is planar can be related to \(K_5\) by Kuratowski’s theorem, which was first published by the Polish mathematician Kazimierz Kuratowski in 1930. This well known theorem in graph theory states that “graph is planar if and only if it does not contain a subgraph that is homeomorphic to \(K_5\) or \(K_{3,3}\)“. In fact the theorem is slightly more general to this, see Wikipedia for a short introduction.

So, if we can show that constructing the graph to include all integers from 2 to 24 would contain a \(K_5\) graph then we can say that the graph is necessarily non-planar.

Taking 4 of the factors of 24, namely 2,3,6 and 12 and we can draw the following graph: 

 These numbers have been chosen so that 24,2,6 and 12 form the complete graph \(K_4\) so that it is planar (i.e. there are no crossing lines), as shown below. 
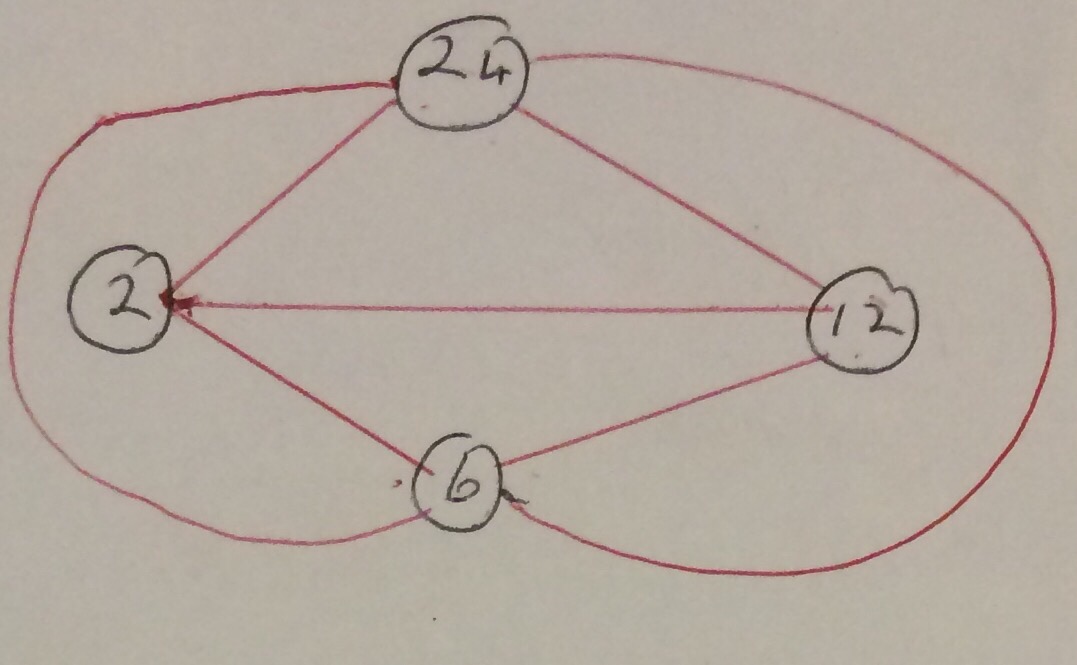
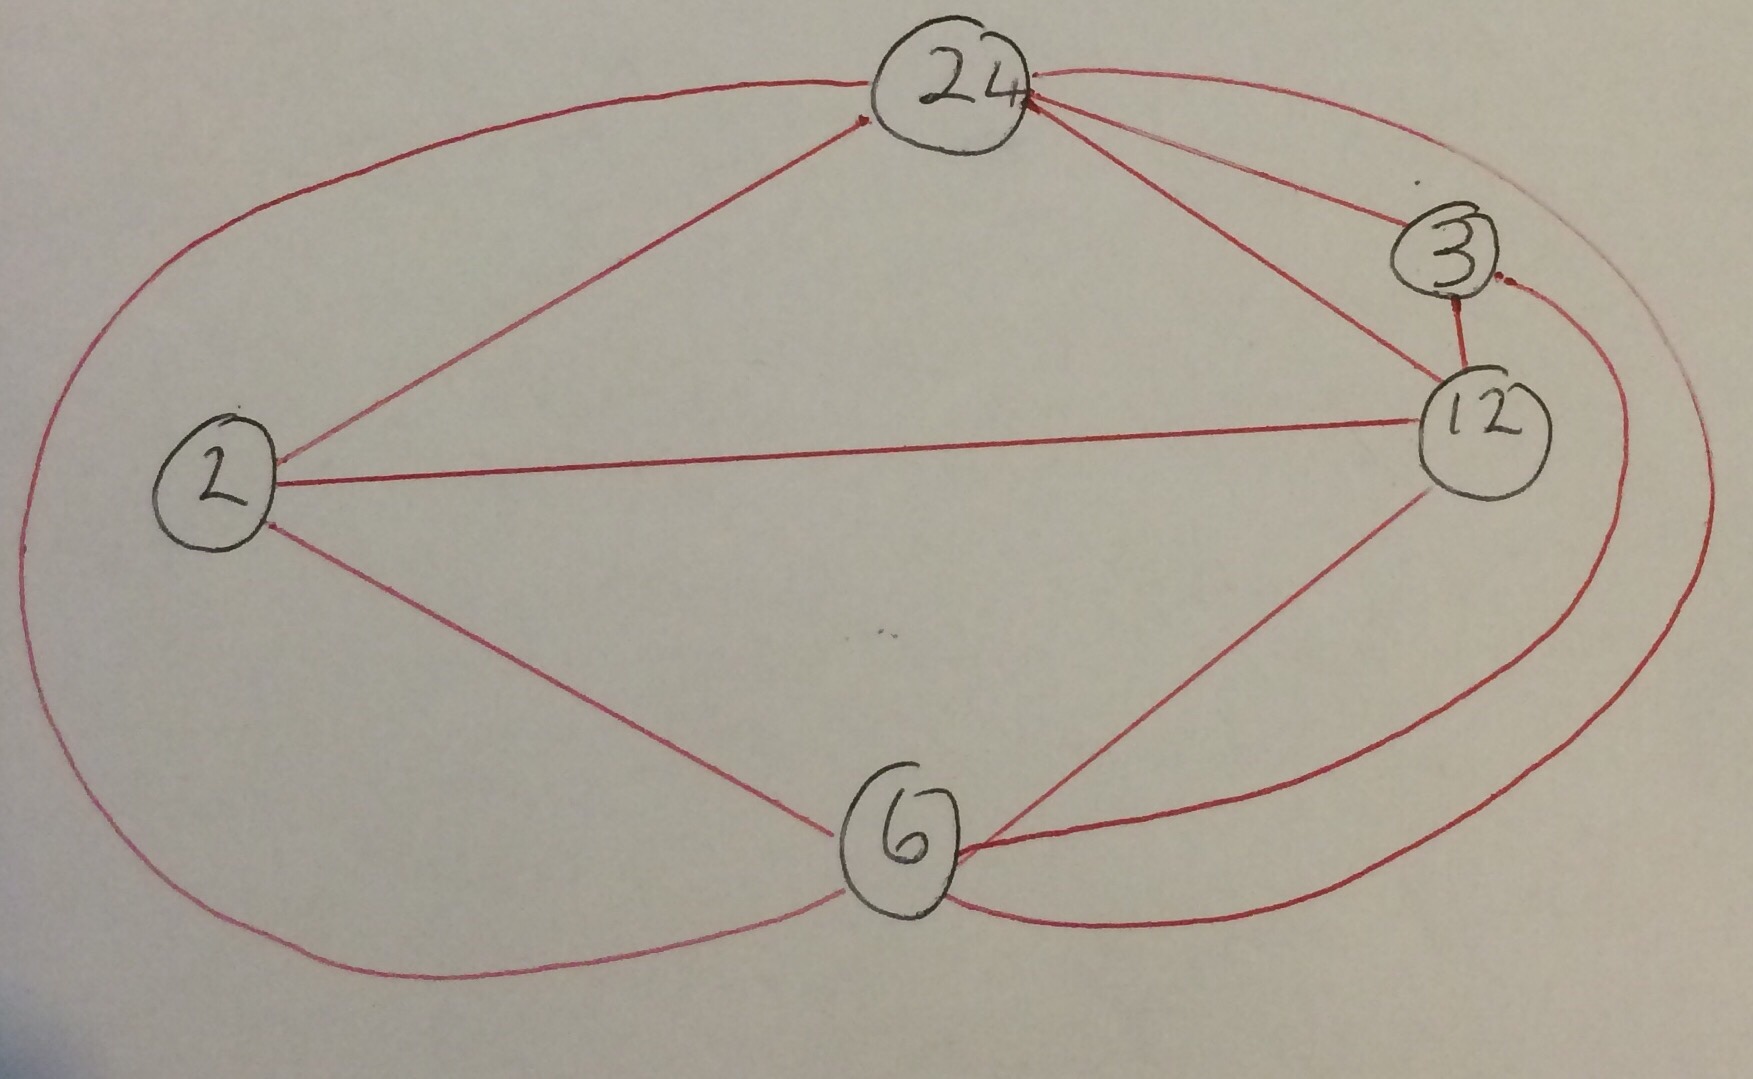
 Can we add another factor – let’s try adding 3. 3 of course joins to 12, 24 and 6, but it doesn’t connect to 3, so at the moment we don’t have a complete graph.  
 However, looking at the graph for the numbers 2 to 23 (which is possible): 
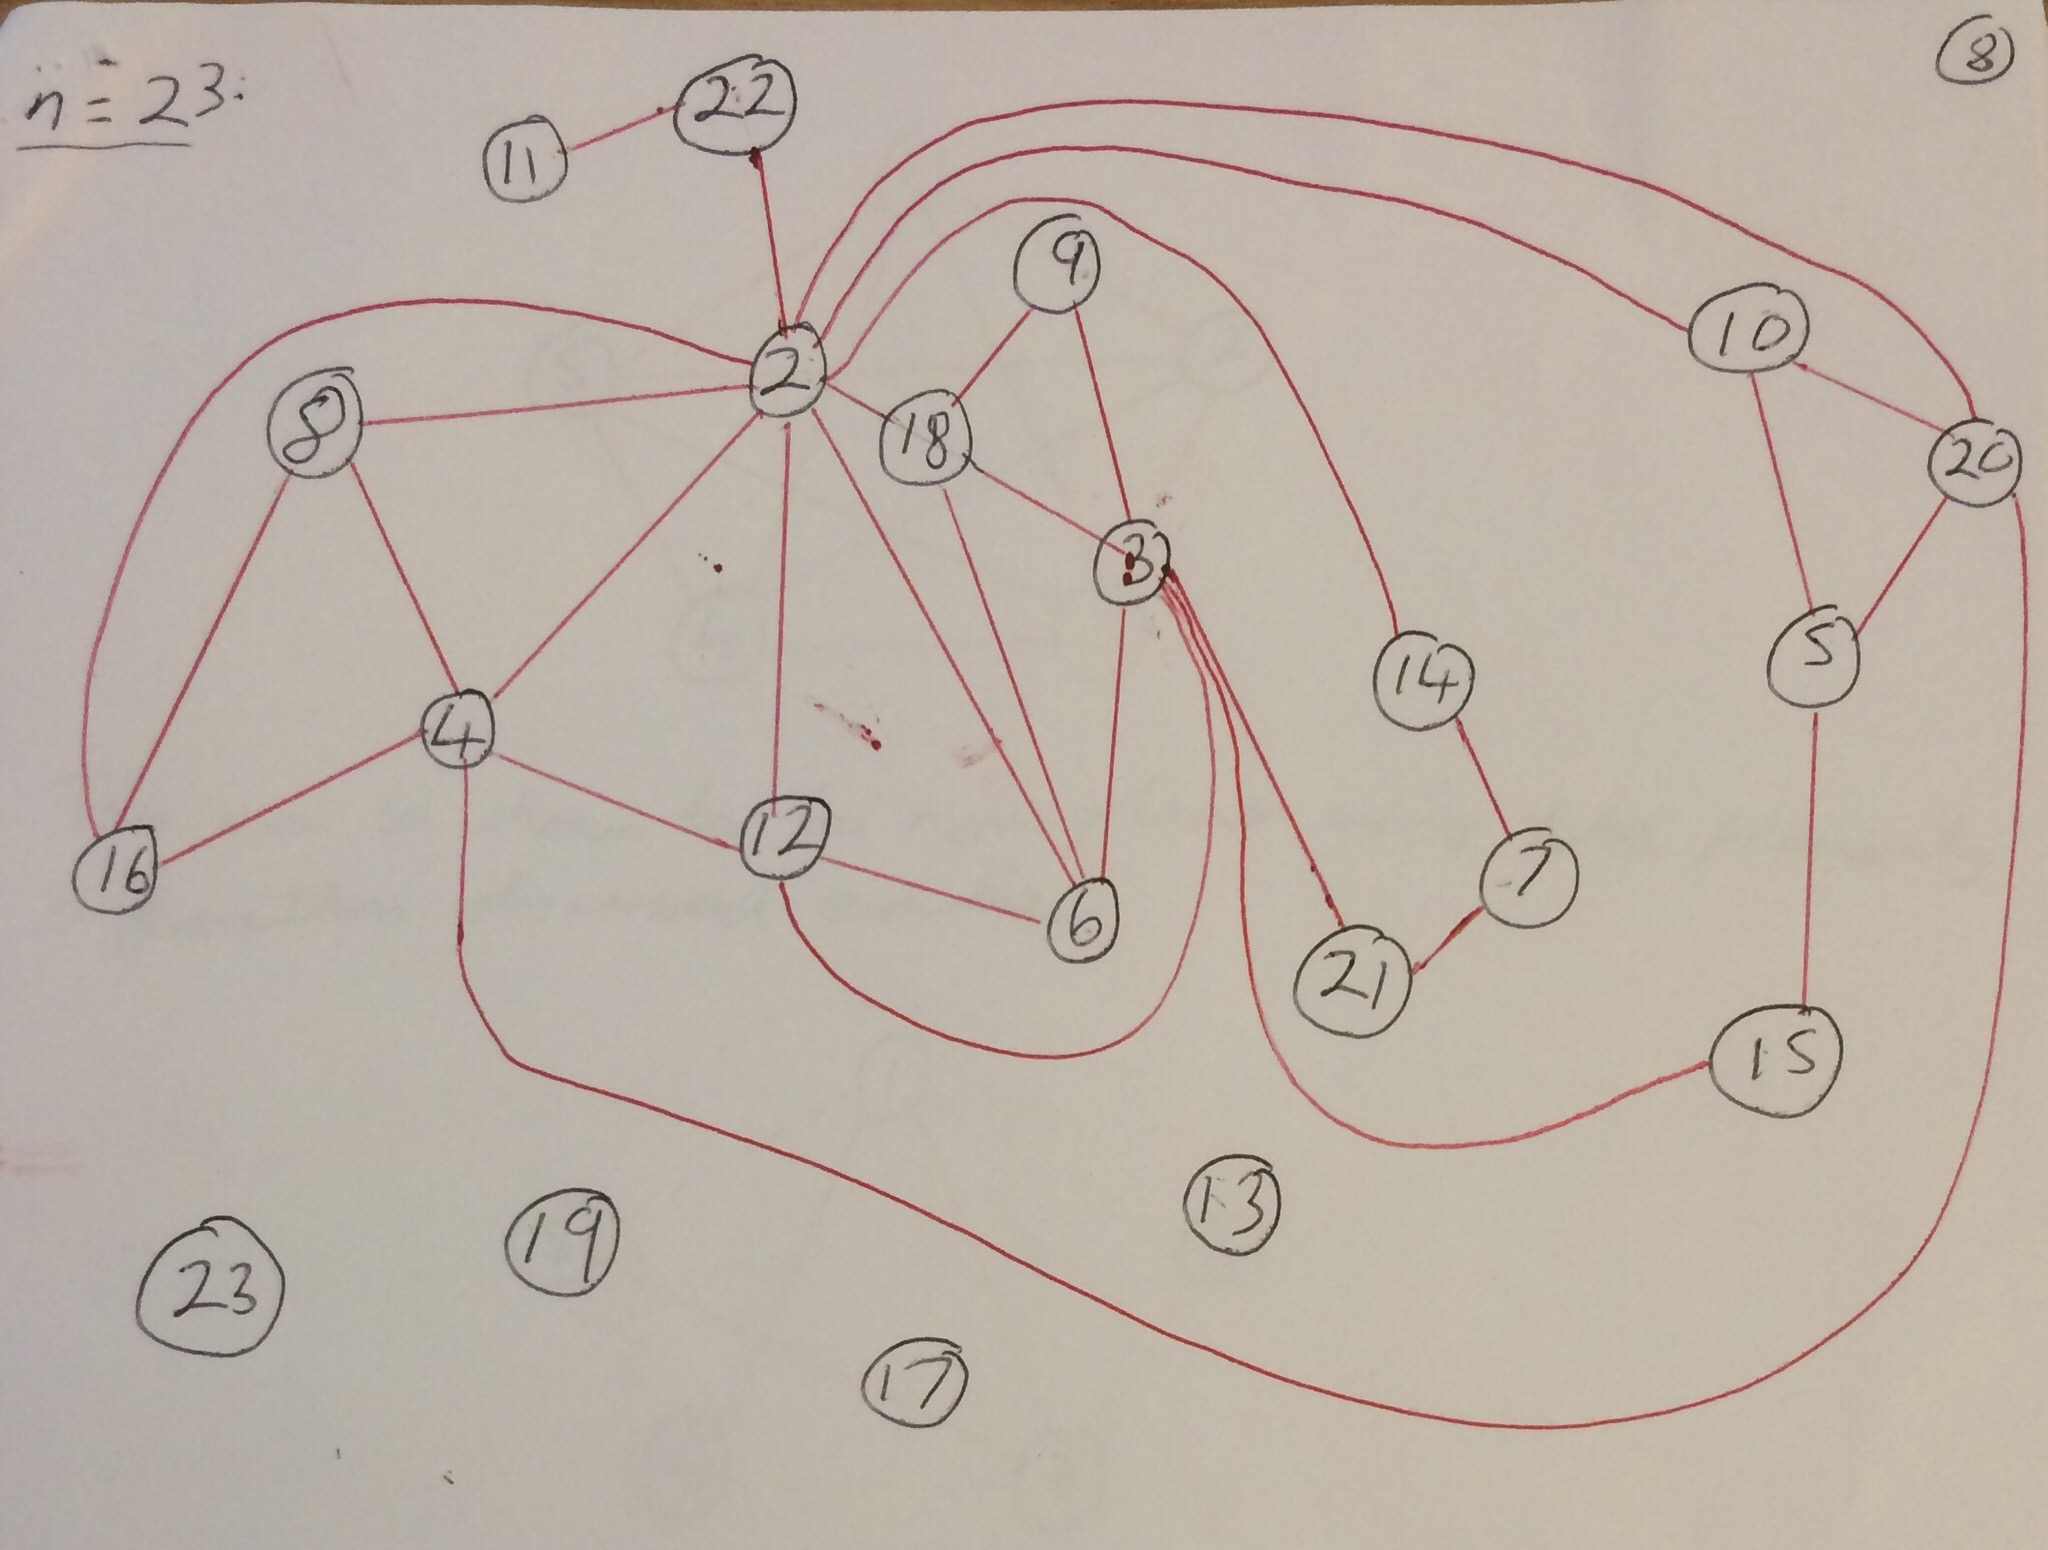
 we can see numerous indirect paths joining 2 to 3, for example 2-18-3, 2-14-7-21-3, 2-6-3, 2-10-20-5-15-3 and 2-12-6-3. It can be seen from our diagram that we cannot add any of these paths to our diagram without introducing a crossing.

Another way to show the non-planirity of the graph containing all the integers 2 to 24 is to relate it to the famous “3 utilities problem”.

I enjoyed this problem, but I didn’t like the fact that you also need to draw the graph for the numbers 2 to 23 to show that 24 is the smallest integer that won’t work.